Download
1 / 19
190 likes | 335 Vues
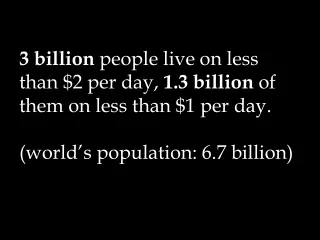
More than half the world lives on less than $2 a day. PRB’s 2005 World Population Data Sheet reveals persisting global inequalities in health and well-being. Presentation by Bill Butz, Carl Haub, Linda Jacobsen, and Roger-Mark De Souza of the Population Reference Bureau, August 23, 2005.

E N D
More than half the world lives on less than $2 a day PRB’s 2005 World Population Data Sheet reveals persisting global inequalities in health and well-being Presentation by Bill Butz, Carl Haub, Linda Jacobsen, and Roger-Mark De Souza of the Population Reference Bureau, August 23, 2005 © 2005 POPULATION REFERENCE BUREAU
The “Demographic Divide”:The example of Tanzania and Poland © 2005 POPULATION REFERENCE BUREAU
Global population growth:A developing country phenomenon Billions Developing countries Developed countries Source: United Nations Populations Division, World Population Prospects, The 2004 Revision, medium variant. © 2005 POPULATION REFERENCE BUREAU
Europe is the only world region projected to decline in population by 2050. Millions © 2005 POPULATION REFERENCE BUREAU
In the developed countries there are fewer and fewer young people, more and more elderly (2005). Millions Age Males Females Source: United Nations Populations Division, World Population Prospects, The 2004 Revision. © 2005 POPULATION REFERENCE BUREAU
The young population of the developing countries has great growth potential (2005). Millions Age Males Females Source: United Nations Populations Division, World Population Prospects, The 2004 Revision. © 2005 POPULATION REFERENCE BUREAU
India’s fertility has declined in fits and starts. Births per 1,000 population Birth rate stabilizes following unpopular birth control program during the “emergency” of the 1970s Resumption of gradual birth rate decrease Source: Registrar General of India, Sample Registration System. © 2005 POPULATION REFERENCE BUREAU
Fertility varies widely across the states of India. Children per woman Source: Registrar General of India, Sample Registration System, 2002. © 2005 POPULATION REFERENCE BUREAU
Thailand represents a smooth transition to below-replacement fertility. Children per woman Family planning program officially begins Source: United Nations Population Division and Population Reference Bureau. © 2005 POPULATION REFERENCE BUREAU
Fertility is higher in the United States than in most other developed countries. Children per woman Source: PRB, 2005 World Population Data Sheet. © 2005 POPULATION REFERENCE BUREAU
Fertility differs considerably among race and ethnic groups in the United States. Children per woman Source: National Center for Health Statistics. © 2005 POPULATION REFERENCE BUREAU
People are living longer than ever before in the U.S., but gaps in life expectancy between blacks and whites persist. Years White female Black female White male Black male Source: National Center for Health Statistics. © 2005 POPULATION REFERENCE BUREAU
Infant mortality for blacks has remained twice as high as infant mortality for whites since the early 1980s. Infant deaths per 1,000 births •Black, non-Hispanic •Hispanic • White, non-Hispanic • Asian Source: National Center for Health Statistics. © 2005 POPULATION REFERENCE BUREAU
Decreases in the rates of child poverty have not closed the gap between minority and white children. Percent living in poverty Black Hispanic White, non-Hispanic Source: Federal Interagency Forum on Child and Family Statistics. © 2005 POPULATION REFERENCE BUREAU
In many parts of the world, rural populations still lack access to safe drinking water. Source: Based on UNICEF, End-Decade Databases, January 2005. © 2005 POPULATION REFERENCE BUREAU
Six of the top 15 energy users are low-income countries. Total energy use, in millions of metric tons of oil equivalent, 2002 Source: World Bank, 2005 World Development Indicators: table 3.7. © 2005 POPULATION REFERENCE BUREAU
High-income countries have the highest energy use per capita. Energy use per capita, in thousands of kilograms of oil equivalent, 2002 Source: World Bank, 2005 World Development Indicators: table 3.7. © 2005 POPULATION REFERENCE BUREAU