Download
1 / 22
230 likes | 475 Vues
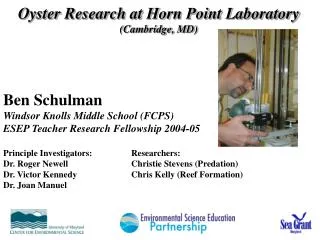
Pigment Analysis by HPLC at Horn Point Laboratory. Laurie Van Heukelem Crystal Thomas Meg Maddox University of Maryland Center for Environmental Science Cambridge, MD, USA. Pencil?! Who uses pencil?. Is that 3625 or 3826??. Emerging from the -25°C freezer. Analysis procedures.

E N D
Pigment Analysis by HPLC at Horn Point Laboratory Laurie Van Heukelem Crystal Thomas Meg Maddox University of Maryland Center for Environmental Science Cambridge, MD, USA
Pencil?! Who uses pencil? Is that 3625 or 3826?? Emerging from the -25°C freezer
Sample processing: As of 10/30/06: 15% of samples analyzed 17% of time elapsed
Scheduling • G. Fargion notifies PI for shipment date • Samples to be completed by December:
Topics of Discussion • Quality Assurance at HPL • Data reports from HPL
Quality Assurance at HPL 1. Method validation 2. Accuracy in Round-Robins 3. Continuous quality assessment
Method Validation • Peak symmetry • Resolution between peaks • Quantitation in the presence of interferences • Linear dynamic range • LOD and LOQ • Accuracy and precision • Spiked recovery
Accuracy in Round-Robins • SIMBIOS, SeaHARRE-1, -2, -3, and -4 • Reference values for natural samples are based on average consensus concentrations • Accuracy is calculated as the % difference from the reference value • Reference values should be determined from results of quality-assured laboratories
Continuous HPLC Quality Assessment at HPL • Establish standardized procedures that limit uncertainties and blunders • Perform Quality Control measurements during the analysis of samples • Identify the range within which QC measurements should fall • Take corrective action if QC measurement falls outside of expected ranges
Data Reports from HPL • Pigments not found and those with a SNR of 4 are given a concentration of 0.0001 • Graph of Effective LOQ (ug/L vs. filtration volume) • The ug/L of pigment in a sample for which the amount of pigment injected was at the instrument LOQ. Effective LOQ varies with changes in Vx and Vf. • LOQ = amount of pigment that results in a SNR of 10