Download
1 / 1
10 likes | 182 Vues
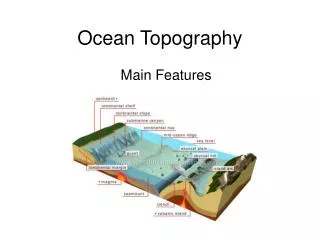
cable. cable. BREAK. ROMBERG TIBURON CENTER. Topography in the vicinity of the array, which is shown as three vertical dots. Fourier transform acoustic data. R. Scan for ship signatures. q. d. Fourier transform spectrograms. 500 Hz. 500 Hz. a. 0 Hz. 0 Hz. 0 Hz. 0 Hz. 0

E N D
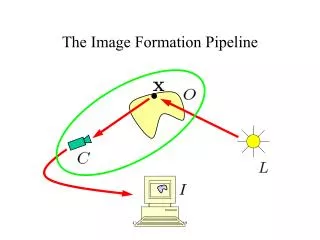
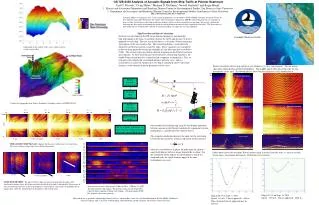
cable cable BREAK ROMBERG TIBURON CENTER Topography in the vicinity of the array, which is shown as three vertical dots. Fourier transform acoustic data R Scan for ship signatures q d Fourier transform spectrograms 500 Hz 500 Hz a 0 Hz 0 Hz 0 Hz 0 Hz 0 Hz 500 Hz 500 Hz 500 Hz 500 Hz 500 Hz Scan result for peaks Faculty Talks, September 9, 2002 Fit set of peaks to distance vs. time curve to confirm ship and determine speed and distance. 0 Hz 0 Hz In August 2001 a vertical linear array (VLA) of four hydrophones was installed by NOAA-PMEL at Pioneer Seamount, 95 km off the California coast and 930 m below the surface. The four channels, digitized at 1000 Hz with 16-bit precision, are available in near real time. In this data set the loudest and most obvious signals are those created by passing ships. We present a method for analyzing the ship signals to determine the speed of each ship and its distance of closest approach to the array. The observatory is now offline due to a broken cable, and due to uncertain funding, no repairs have yet been planned. OS 72B-0355 Analysis of Acoustic Signals from Ship Traffic at Pioneer SeamountCarl O. Vuosalo,1 Craig Huber,1 Michael D. Hoffman,1 Newell Garfield,2 and Roger Bland11. Physics and Astronomy Department and Romberg Tiburon Center for Environmental Studies, San Francisco State University2. Department of Geosciences and Romberg Tiburon Center for Environmental Studies, San Francisco State Universityhttp://www.physics.sfsu.edu/~seamount Ship Detection and Speed Calculation Software was developed in the IDL programming language to automatically find ship signals in the data set and then calculate the speed and distance of closest approach of each ship. The first step in this process is to make a Fourier transform spectrogram of the raw acoustic data. This transformed data is scanned for the distinctive interference pattern created by ships. These signatures are considered to be two sharp peaks that are integer multiples of each other and that occur below 21 Hz. The second step is to perform a Fourier transform on the Fourier transform spectrograms. At those locations previously found to contain ship signatures, the double Fourier transforms are scanned to find a sequence of sharp peaks. This set of peaks is then fitted with a calculated distance and time curve, and if a reasonable fit is achieved, the presence of a ship is confirmed, and its speed and distance can be obtained from the parameters of the curve. Fourier transforms of two ship signals to give frequency vs. time spectrograms. The top panels show data summed from all four hydrophones. The middle panels show data from only the top hydrophone of the array. The bottom panels show Fourier transforms of the middle panels. FOUR HYDROPHONES FOUR HYDROPHONES • COMPUTER SIMULATION • dmon = 3600 m • speed 15.8 m/s (30 knots) • flat sea bottom • white noise Underwater topography near Pioneer Seamount. (Graphics courtesy of PMEL/NOAA) ONE HYDROPHONE ONE HYDROPHONE 15 min ONE HYDROPHONE time One method of calculating ship range R, based upon separation between maxima in the Fourier transform f, separation between hydrophones a, and the speed of sound in water c. The computer simulation shown to the right, for the faster ship, is based on this geometry, using an expression for the intensity, where is the difference in phase for paths from the ship to a single hydrophone and to its image beneath the sea floor. For the simulation shown and for the spectrogram to which it is compared, only the signal from the upper of the four hydrophones was used. 0 “FFT OF FFT” “FFT OF FFT” 9 m/s 14 m/s (28 knots) 7 m/s 9 m/s 6 m/s THE LOUDEST SHIP SIGNALS. Signals like this arrive about once every three days. The are the loudest sounds observed at Pioneer Seamount. 6:00- 8:00 UT 8:00- 10:00 UT Fitted speed curves for two ships. Plot of surface range in meters from the array vs. time in seconds. Green curves based upon blue points. Red points were rejected. 10:00- 12:00 UT 12:00- 14:00 UT 14:00- 16:00 UT 16:00- 18:00 UT 18:00- 20:00 UT 13 m/s 9 m/s 20:00- 22:00 UT 16 m/s (32 knots) 22:00- 24:00 UT SOME FASTER SHIPS. The speed of these ships has been estimated from the slope of the interference maxima, since the fitting procedure described to the right is disrupted by the presence of the constant-frequency lines on these spectrograms (vertical lines). These lines are probably due to engine noise, while the smoother part of the pattern is due to prop noise. Spectrograms for an 18-hour period (23:00 July 20 to 17:00 July 21, PDT) showing numerous ship signals. The patterns gating on and off probably represent boats stopping or idling while fishing. (All spectrograms 0-500 Hz, frequency increasing upwards.) Ship at 21:15 on Sept. 10, 2001. Speed: 15.8 m/s. Closest approach: 3656 m. Ship at 08:15 on Sept. 8, 2001. Speed: 6.1 m/s. Closest approach: 645 m. This calculated closest approach may be too low. Help and advice is gratefully acknowledged from:Chris Fox, Jonathan Klay, Andy Lau, and Haru Matsumoto, NOAA-PMEL; Jim Mercer and Lyle Gullings, APL, University of Washington; and John Bourg and Jim Lockhart, San Francisco State University