BENCHMARKING:
BENCHMARKING:. “A CONTINUOUS PROCESS OF MEASURING OWN VITAL FACTORS AGAINST LEADERS OR COMPETITORS” Benchmarking: the process of comparing Benchmarking tools: simple or complex ratios (‘indicators’) Indicators: made up of data parameters such as revenue, costs, added value, etc.

BENCHMARKING:
E N D
Presentation Transcript
BENCHMARKING: “A CONTINUOUS PROCESS OF MEASURING OWN VITAL FACTORS AGAINST LEADERS OR COMPETITORS” • Benchmarking: the process of comparing • Benchmarking tools: simple or complex ratios (‘indicators’) • Indicators: made up of data parameters such as revenue, costs, added value, etc. Issues: Identify indicators, data availability, comparison at enterprise level vs. between enterprises. EPIC, GOLEM IMS GMBH, Austria
Comparing similar factors in different enterprises, e.g.: ==> Performance of wood furniture mfg in two different enterprises how materials are purchased how suppliers are paid how inventories are managed how employees are trained how payrolls are processed how fast new products get to the market how quality is managed KPI change in given industrial sector over time Comparing performance of key industrial sectors BENCHMARKING EPIC, GOLEM IMS GMBH, Austria
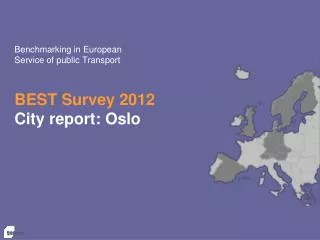
Benchmarking - for Systematic Comparison of the Development • ENTERPRISE: to assess own status and development vs. own goals • SECTOR / MARKET: comparison with important countries or regions. • BASIS: quantitative indicators • DYNAMISM: relative position and development trends • COMPRIHENSIVENESS: several areas and different indicators EPIC, GOLEM IMS GMBH, Austria
Databases on sub-regional levels with enterprise data Data suppliers at the enterprise level in different industrial sectors Data customers / users Internet as media for providing & obtaining benchmark data Administrative routines and incentives for the capturing of enterprise data and information exchange Who collects data and how? Standards vary Who are providers? Will I provide data to my competitors? Who will use it and how? What are the metrics? Validity of data? Who are customers? Prices, completeness, authorization, access, etc. Few polices and solutions are available besides administrative taxation and annual reporting. One way communication INFORMATION NEEDS vs PROBLEMS FACED EPIC, GOLEM IMS GMBH, Austria
Ethical Guidelines and …. barriers! • avoid talking about areas which involve pricing or competitively sensitive costs • don't ask competitors for sensitive data • don't share proprietary information without clearance • use third parties to assemble and present data • don't disparage competitors' business based on data obtained from benchmarking EPIC, GOLEM IMS GMBH, Austria
BENCHMARKING - CONCLUSION • Important tool for entrepreneurs • Difficulties in obtaining data • Sensitivity of entrepreneurs to releasing data • Data validity verification • Incentives for entrepreneurs taking part • Cultural differences • it is a critical technique for making organizational transformation easy • undertaking benchmarking requires an organizational willpower • companies unable to muster the willpower to compare themselves with the world's best cannot implement any improvement approach • benchmarking either demonstrates the requisite willpower or demonstrates its absence EPIC, GOLEM IMS GMBH, Austria
SUMMARY: • Benchmarking is a Process! • Benchmarking is not a goal in itself but helps identifying areas requiring further analysis and improvements. • Extensive and systematic comparison using more than one variable. • Trend implementing a benchmarking approach. EPIC, GOLEM IMS GMBH, Austria
Pharos Benchmarking Objectives • Obtaining information about absolute and relative change of major business indicators for the current date compared to some reference date in the past. • Presenting this information in easy way for analysis such as radar graph and time series graphs. • Providing trend identification and analysis tools by using simple variable averaging method. • Allowing flexibility in defining any desirable averaging period within interval of 1-12 months. • Using actual data available in Pharos and Produce Plus enterprise databases for obtaining objective results. EPIC, GOLEM IMS GMBH, Austria
Objectives continued • Minimizing subjective judgments by management and intermediaries • Complementing questionnaires, minimizing sensitivity of proprietary information • Simplifying & speeding up processing of results with minimum human errors, incompetence and delays • Obtainingresults easy, simple and quickly at any moment of time. • Assuring of entrepreneur confidence by viewing only relative change figures in percent to reference point in the past in business reports protecting sensitive KPIs • Facilitating public discussions of performance management issues and knowledge distribution. EPIC, GOLEM IMS GMBH, Austria
7 Indicators • Net Profit (Pre Tax) • Expenses Overall • Sales Revenue • Overall Added Value • Overall Added Value per Employee • Labor Ratio (Produce Plus) • OEE (Overall Equipment Efficiency, ProdPlus) EPIC, GOLEM IMS GMBH, Austria
Formats • Radar Chart • Time series • Period • Averaged • Brief Summary Report • Detailed Summary Report EPIC, GOLEM IMS GMBH, Austria
Reference Benchmarking:Added Value per Employee EPIC, GOLEM IMS GMBH, Austria
Reference Benchmarking:Net Profit EPIC, GOLEM IMS GMBH, Austria
Reference Benchmarking:Expenses EPIC, GOLEM IMS GMBH, Austria
KPI Change: Absolute & Relative EPIC, GOLEM IMS GMBH, Austria
Pharos Benchmarking:Definition of parameters EPIC, GOLEM IMS GMBH, Austria
Reference Benchmarking:Summary EPIC, GOLEM IMS GMBH, Austria
Conclusions • Pharos Benchmarking provides simple and effective tools for easy measuring and monitoring business results • The source data is real enterprise database not questionnaires and third party interviews • It presents absolute and relative values of change • Available for an entrepreneur in continuous improvement process by mouse click at any time • Relative improvement reports can be promptly presented to prospective investors, banks or important customers • Report becomes excellent validation to business proposal • Benchmarking helps evaluating business development scenarios, decision consequences, innovations, strategies • Excellent educational and business gaming tool • Usable for comparing multiple enterprises (XML reports) • Can be further extended up to any number of benchmarking indexes EPIC, GOLEM IMS GMBH, Austria