
Monte Carlo Method for Estimating Discharge Uncertainty in Field Measurements
This guide demonstrates how to apply the Monte Carlo method for estimating the discharge ( Q ) of a channel based on measured flow velocity ( u ) and cross-sectional area ( A ). By utilizing field data from five groups of measurements, we aim to analyze the uncertainty associated with our calculations. The process involves selecting simulated values from assumed probability distributions of velocity and area, computing multiple ( Q ) values, and analyzing the resulting statistics to understand how measurement uncertainties propagate through calculations.

Monte Carlo Method for Estimating Discharge Uncertainty in Field Measurements
E N D
Presentation Transcript
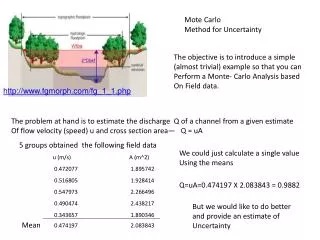
Mote Carlo Method for Uncertainty The objective is to introduce a simple (almost trivial) example so that you can Perform a Monte- Carlo Analysis based On Field data. http://www.fgmorph.com/fg_1_1.php The problem at hand is to estimate the discharge Q of a channel from a given estimate Of flow velocity (speed) u and cross section area— Q = uA 5 groups obtained the following field data We could just calculate a single value Using the means Q=uA=0.474197 X 2.083843 = 0.9882 But we would like to do better and provide an estimate of Uncertainty Mean
Clearly from the available five measurements of velocity and area we can calculate the properties (statistics) of the measurement distributions. U A This gives us an idea about the uncertainty in our measurements—but we would like to know How does this uncertainty manifest itself in our calculated variable Q = uA i.e., How do the uncertainties in our measured variables propagate through calculations ? and How do uncertaninties combine to form the pdf of the calculated variable? For this we use a so-called Monte-Carlo technique http://en.wikipedia.org/wiki/Monte_Carlo_method In the current case we 1:use assumed forms of the distributions (pdfs) of velocity and area with the distribution measures (e.g., mean and std) calculated from our given 5 sets of field measurements 2: Select 100+ simulated field measured values of u and A (at random) from these assumed pdfs 3: Calculate 100+ values of Q and make statistics from the resulting distribution
All most all the statistics Voller knows A set of independent random numbers (variables) for a probability density function (pdf) Two common forms are frequency Where a random number x is in the interval [min, max] The uniform pdf The normal distribution min max mean of variables Wikipedia Standard Deviation Measure of spread or likelihood of occurrence 68.2% of members are with in one “sigma” of mean Excel Formula • The excel function rand() generates a random number • in the uniform distribution [0,1] • 2. The excel function stdev(range) gives the standard deviation • of a the selection (range) of variables from a normal • 3. The excel function average(range) gives the mean of those numbers
Three more important formulas related to normal distributions • If x belongs to a normal random dist. With • mean “mu” and st.dev “sigma”. Then the • variable Belongs to the Standard Normal Dist of mean mu = 0 and st.dev sigma=1 2. The above formula is invertible so if we select a variable z at random from the standard normal we can find the equivalent variable x in the normal dist of mean mu and standard deviation sigma through 3. The Box Muller formula: If we select at random two variables U and V from the uniform distribution [0,1] the formula gives us a standard normal random variable, i.e., a variable in the normal pdf of mean mu =0 and standard deviation sigma = 1
MC with uniform pdf—we could do this analytically but this will demonstrate steps Start by Calculating means, max, min and for later STD. Note an analytical MC estimate can be obtained from Q=meanu X meanA maxQ=maxu X maxA minQ=minu X minA Enter data Into spread- sheet Name Each cell, e.g. maxA Appropriate excel function But a Manuel MC is as follows Q Starting in cell c15 of the spread sheet create the following line of 5 cell operations c15 d15 e15 f15 g15 =rand() =rand() =minu+(maxu-minu)*c15 =minA+(maxA-minA)*d15 =e15*f15 Copy this line of 4 equations 100 (or more times) down the Sheet . Each copy representing the data collection efforts of an imaginary group governed by the same statistics The mean of Q of these data will be the Q value and the range will be given by maxQ - minQ You could also calculate the standard deviation of the Q values but here this has no meaning
Assuming a normal pdf takes a little more work—not sure if there is a closed solution Start in cell k15 and write down an excel line with 9 cell operations The first 6 cells operations are k15 l15 m15 n15 o15 p15 rand() rand() rand () rand()sqrt(-2*ln(k15))*cos(2*pi()l15) sqrt(-2*ln(n15))*cos(2*pi()o15 The next three create the pseudo data and calculate Q q15 r15 t15 =stdu*o15+meanu =stdA*p15+meanA =q15*r15 As before Copy this line of 4 equations 100 (or more times) down the Sheet . Each copy representing the data collection efforts of an imaginary group governed by the same statistics The mean of Q of these data will be the Q value and the +- range will be now be given by the calculated standard deviation of the Q values
Not all distributions are quite as straightforward as Uniform and Normal One of particular importance is the Lévy distribution http://en.wikipedia.org/wiki/L%C3%A9vy_distribution “In probability theory and statistics, the Lévy distribution, named after Paul Pierre Lévy, is a continuous probability distribution for a non-negative random variable” c is scale parameter mu is shift mu=0 What property does this distribution have that makes it applicable to environmental applications ?
What property does this distribution have that makes it applicable to environmental applications ? Allows for the Finite probability of an extreme event Fat—power-law tail Also—no mean or variance !!