Mapping Global CO2 Concentrations: Insights from the 2009 Workshop
This document outlines recommendations from a 2009 workshop on mapping CO2 concentrations, focusing on experiments to refine global models and enhance signal detection methodologies. Key areas include flux sensitivity analysis, the generation of atmospheric CO2 flux maps, and the application of geostatistical methods for spatial distribution of XCO2. Volunteered global models such as LMDZ and PCTM are discussed, alongside the development of sampling strategies and error quantification techniques. The aim is to improve understanding of CO2 distribution fluctuations and their implications.

Mapping Global CO2 Concentrations: Insights from the 2009 Workshop
E N D
Presentation Transcript
Experiments for ascends Dorit Hammerling Anna M. Michalak, Randy Kawa,VineetYadav, AbhishekChatterjee, Sharon Gourdji, Deborah Huntzinger, Kim Mueller, Chris O’Dell,
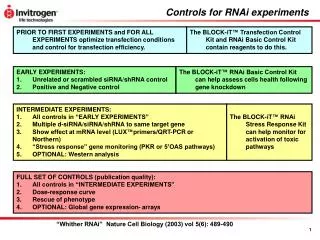
Recommended experiments from 2009 workshop • Flux Sensitivity • Mapping of XCO2 • Signal Detection • Inversions
Benefits Based on 2009 workshop
Mapping XCO2 • Who: 2 or more global models • What: global maps and uncertainties • When: 4-6 months • Where: • Why: orbit, error variance / correlations, cloud / aerosol cutoffs/errors, correlation of errors w/ clouds/aerosols • How: 2 months per model Recommendations from 2009 workshop
Mapping XCO2 • Volunteered global models: LMDZ, PCTM • Applied to AIRS, GOSAT, OCO-like data • Experimental outline by Michalak: • Generate flux maps. • Generate space-time fields of atmospheric CO2 • Develop sampling strategies. • Sample model output. • Develop / adapt mapping tools. • Perform mapping. • Repeat for alternate design options (e.g. orbit, measurement error, vertical weighting function) • Quantify errors as both predicted errors, and actual errors from true 4d distributions from models.
Mapping global CO2 from space – OCO-2 Hammerling, Michalak, Kawa (JGR, in press) See also Alkhaled et al. (GRL 2008; JGR 2008)
Methodology • Geostatistical method – concepts: • The XCO2 field is continuous and spatial correlation is a function of distance • Spatial correlation is used to gap-fill and derive a probability distribution for the XCO2 concentration at each location • Features of geostatistical method: • No transport model or prior assumption required • Correlation structure derived from the data - locally varying • Measurement error incorporated - locally varying • Uncertainties derived along with global XCO2 concentrations Source: A. M. Michalak, University of Michigan
Methodology (cont.) • Quasi-stationarity: process is assumed stationary within local neighborhood, but nonstationary globally gridcell 2000 km A. Alkhaled, Kuwait University
Mapping global CO2 from space – OCO-2 Hammerling, Michalak, Kawa (JGR, in press) See also Alkhaled et al. (GRL 2008; JGR 2008)
Mapping CO2 from space – OCO-2 Hammerling, Michalak, Kawa (JGR, in press)
Evaluation: prediction accuracies 1-day 2-day 4-day 8-day 16-day RMSPE [ppm] January April July September low noise medium noise high noise covariance derived from truth covariance derived from observations Hammerling, Michalak, Kawa (JGR, in press)
Evaluation: prediction uncertainties 1-day 1-day 2-day 2-day 4-day 4-day 8-day 8-day 16-day 16-day Percent of grid cells with error > 3 Percent of grid cells with error > 3 January January April April July July September September low noise low noise medium noise medium noise high noise high noise covariance derived from truth covariance derived from truth covariance derived from observations covariance derived from observations Hammerling, Michalak, Kawa (JGR, in press)
Mapping XCO2 • Similar setup and evaluation could be used for ASCENDS …..
Simulated ASCENDS observations (July) 1 day 2 day [ppm] 4 day 3 day [ppm]
Simulated ASCENDS observations (July) 1 day (no errors) 1 day (with errors) [ppm] Errors based on Calipso [ppm]
Signal Detection • Who: 2 or more global models • What: Investigate impact of flux variations on observations • When: 4-6 months • Where: • Why: Evaluate orbits, error variance / correlations, weighting functions, some contribution to question re. spatial / temporal scale of fluxes that can be resolved, question of day/night measurements • How: 2 person weeks per scenario, couple of days to implement, 3-4 months for central organizer, 1 month per model for participants Recommendations from 2009 workshop
Signal Detection • Volunteered global models: LMDZ (Rayner), PCTM (Kawa) • Experimental outline by Kawa: • Baseline forward run • Perturbation fluxes (e.g. missing NH terrestrial sink: scaling CASA GPP; mean transcom posterior; tropical land use source flux distribution; scale FF source to some IPCC future; el nino flux distribution) • Compare Baseline and Perturbation pseudo-measured fields and error bars • Vary sampling and/or error characteristics in 3)
Specific scenario already set up • “Increase of fossil fuel emissions in China” In order to model the case where emissions from China gradually increase, a simulation was run which only included the "extra" amount of CO2, above the baseline values. The field was initialized to zero. Fossil fuel emissions began at zero, and were increased linearly in the region of China, such that the flux at the end of 10 years would match the 2006 CDIAC/ORNL emission rates for that region. There were no additional ocean or biosphere fluxes. [ASCENDS project webpage]
Signal Detection • Maybe we could combine signal detection with mapping?
GOSAT Level 3: used for model comparison Summary for 2009 Same idea could be applied for signal detection. August 7-12 2009 August 7-12 2009 [Hammerling et. al. (in revision)] [Hammerling et. al. (in revision)] [Hammerling et. al. (in revision)]
How consistent are models with satellite-derived XCO2 field? [ppm] Source: Huntzinger et al., 2011 [ppm]
For which locations are difference in the XCO2 probability distribution detectable ? Scenario 2 Scenario 1 [ppm]
Ideas for Contributions to ASCENDS • Combining mapping and signal detection • Additional scenarios of interest: • “Difficult” scenarios: • Change in pattern of flux • Change in timing • …….
Which experiments moving forward? • Flux Sensitivity • Mapping of XCO2 • Signal Detection • Inversions
Acknowledgments • PUORG: AbhishekChatterjee, VineetYadav, Dan Obenour, Yoichi Shiga, Vineet Yadav, YuntaoZhou, (Alumni:) AlanoodAlkhaled, Charles Antonelli, Sharon Gourdji, Debbie Huntzinger, Meng-Ying Li, Kim Mueller, Jill Ostrowski, David Sena, Shahar Shlomi (+ many ugrad students) • NOAA-ESRL: Pieter Tans, Adam Hirsch, Lori Bruhwiler, Arlyn Andrews, Gabrielle Petron, Mike Trudeau • AER: Thomas Nehrkorn, John Henderson, JanuszEluszkiewicz • NACP Regional Interim Synthesis Participants • Kevin Schaefer (NSIDC), Tyler Erickson (MTRI), Kevin Gurney (Arizona State U.), John C. Lin (U. Waterloo), Peter Curtis (OSU), Christian Rödenbeck (MPIB), Amy Braverman (JPL), Noel Cressie (OSU), Randy Kawa (NASA GSFC), Clay Scott, Long Nguyen, Mike Cafarella, Kristen Lefevre (UM) • NOAA-ESRL Cooperative Air Sampling Network • NASA HEC Project Columbia, Pleiades, and technical support staff