Download
1 / 41
410 likes | 505 Vues
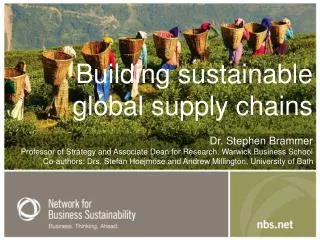
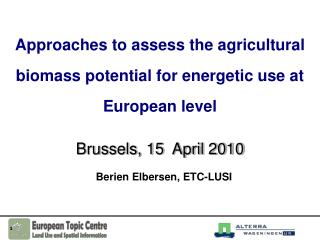
Sustainable biomass supply in the EU Dr. Berien Elbersen, Alterra. Presented at the Biomass Futures-FNR Workshop Biomass sustainability criteria November 30, 2010 in Berlin. 1. Outline. Environmentally sustainable biomass availability

E N D
Sustainable biomass supply in the EU Dr. Berien Elbersen, Alterra Presented at the Biomass Futures-FNR Workshop Biomass sustainability criteriaNovember 30, 2010 in Berlin June 2009- December 2011- EIE/08/653 30/4/2010 1
Outline • Environmentally sustainable biomass availability • Estimates of different biomass potentials and related sustainability considerations • Waste • By-products agriculture • Dedicated cropping • Cost-supply relations • Conclusions and further steps June 2009- December 2011- EIE/08/653 30/4/2010 2
Biomass categories included • Biomass from waste • Waste biomass • Primary, secondary, tertiary residues • Biomass from agriculture • Dedicated cropping • Primary residues (straw, prunnings, manure) • Biomass from forestry • Round wood production • Additionally harvested wood • Primary forestry residues • Secondary forestry residues June 2009- December 2011- EIE/08/653 30/4/2010 3
Environmental constraints No sustainability constraints Many sustainability constraints • Different biomass resources have different sustainability considerations: • Waste products • By-products • Forestry products • Dedicated cropping June 2009- December 2011- EIE/08/653 30/4/2010 4
Wastes Source: Eurostat waste statistics (year 2008). June 2009- December 2011- EIE/08/653 30/4/2010
Present recovery of which some going to bioenergy June 2009- December 2011- EIE/08/653 30/4/2010
Verge grass EU: 1.9 mln TOE (2% of total potential) June 2009- December 2011- EIE/08/653 30/4/2010
Summary for wastes June 2009- December 2011- EIE/08/653 30/4/2010
Conclusions on waste potential • Overall large potential, but other competing uses, especially for cardboard and wood-wastes • Practically no sustainability problems related to the use • Present collection systems different in EU • In principle cheap resource, but still many logistical problems related to collection • EU wide data on availability unreliable June 2009- December 2011- EIE/08/653 30/4/2010
Agricultural by-products • Manure • Straw • Prunings June 2009- December 2011- EIE/08/653 30/4/2010
Manure Factors determining potential: • Type and animal numbers (LSU/ ha forage area) • Sustainability constraints: • Loss of soil fertility (over-exploitation of manure) • Abandonment of grazing (abandonment of land) to move to housing system and collect manure • Therefore the sustainable potential is only the the surplus manure (surplus= >170 kgN/ha) • Source data used: Eurostat FSS, NVZ maps, own elaborations June 2009- December 2011- EIE/08/653 30/4/2010
Manure available (2005) EU: 6.7 mln TOE (4.8% of total potential) EU: 1.6 mln TOE (1.1% of total potential) June 2009- December 2011- EIE/08/653 30/4/2010
Straw • JRC approach • Sources of straw: all cereals, maize (straw of corn), rapeseed, sunflower • Sustainability constraints: • too much straw removal could lead to soil fertility (Soil C) loss • Therefore estimated sustainably harvested potential (40% for cereals and 50% for rest) • Minus competing uses (animal bedding, mushroom production) June 2009- December 2011- EIE/08/653 30/4/2010
Straw EU: 28 mln TOE (based on CAPRI baseline scenario 2020) EU: 16 mln TOE (12% of total potential) June 2009- December 2011- EIE/08/653 30/4/2010
By-products from pruning and clearing Factors determining potential: • Permanent cropping area (e.g. vineyards, fruit trees, nuts and berries, olives and citrus) • Sustainability constraints: • Some risk of soil compaction, if heavy machinery used • Loss of soil carbon when roots removed of old plantations, certainly when ploughed up after many years • Source data used: Eurostat FSS, own elaborations June 2009- December 2011- EIE/08/653 30/4/2010
Pruning material available (2005) June 2009- December 2011- EIE/08/653 30/4/2010
Total pruning material (2005) EU: 6.7 mln TOE (5% of the total present potential) June 2009- December 2011- EIE/08/653 30/4/2010
Dedicated cropping: sustainability June 2009- December 2011- EIE/08/653 30/4/2010
Biomass cropping/harvesting effects on environment through: • Land use change effect (including iluc) • Conversion of natural/semi-natural land use categories (e.g. tropical forests, extensive grasslands) • Conversion of degraded land • Conversions in existing arable land (e.g. from annual to perennial) • Intensification/extensification effect in existing agricultural lands because of an overall change in practice (e.g. crops, input use) • Climate change effect, mitigation (?) reduces adverse effects on biodiversity June 2009- December 2011- EIE/08/653 30/4/2010
Present situation Dedicated bioenergy crops 2008 June 2009- December 2011- EIE/08/653 30/4/2010
Land & water requirements bioenergy: present June 2009- December 2011- EIE/08/653 30/4/2010
Future situation? • Biofuel crops • Perennial crops June 2009- December 2011- EIE/08/653 30/4/2010
2020 CAPRI biofuel cropping EU Product coverage in the CAPRI 2020 biofuel module: BAS scenario Shock: EU biofuel demand in 2020 June 2009- December 2011- EIE/08/653 30/4/2010 Source: IPTS (2010) CAPRI derived these from AGLINK-COSIMO simulations.
CAPRI supply distribution 2020 RED But demand for imported biodiesel and bioethanol not included! June 2009- December 2011- EIE/08/653 30/4/2010
CAPRI-2020 RED • Net change in: • Land use (cropping pattern) • Livestock (numbers+types) • This effect was assessed within EU in EEA study • Soil N2O emissions • Changes in Soil C • N-Leaching (inside and outside HNV farmland) June 2009- December 2011- EIE/08/653 30/4/2010
Effect: Soil N2O emissions June 2009- December 2011- EIE/08/653 30/4/2010
Net impact of Soil C (2004-2020 compared) June 2009- December 2011- EIE/08/653 30/4/2010
Change in N-surplus HNV + RED HNV + NO RED NO HNV+ NO RED NO HNV + RED June 2009- December 2011- EIE/08/653 30/4/2010
Future dedicated cropping with perennials • Based on land availability and cropping mix as predicted by CAPRI in baseline scenario • 3 options: • High support for cropping, competes with arable crops on good-medium productive arable lands • Some cropping support, is economic on fallow land and former olives and vineyards i.e. the lower productive lands • Some support for establishment and bringing back into production of abandoned land in areas with large abandoned land resource June 2009- December 2011- EIE/08/653 30/4/2010
On good-medium productive arable lands • Assumption of 5% of 2020 good-medium quality land • High yield per hectare • Very large indirect land effects • Southern Europe large pressure on scarce water resources • Largest potential: 30 Mln TOE June 2009- December 2011- EIE/08/653 30/4/2010
On low productive arable lands • Assumption: 10% of 2020 fallow, olive and vineyards • Medium-low yield per hectare • Limited indirect land effects • Large adverse effects on biodiversity • Lowest potential: 10 mln TOE June 2009- December 2011- EIE/08/653 30/4/2010
On former abandoned lands • Estimate: regional abandoned land share 5%-10% of UAA. Of this 5% used for dedicated biomass cropping • Low yield per hectare • No indirect land effects • Some negative effects on biodiversity • Effect on soil C: tbd • Average potential: 15.5 mln TOE June 2009- December 2011- EIE/08/653 30/4/2010
Conclusions dedicated cropping • Present dedicated cropping area still relatively small both inside and outside EU. • In 2020 net environmental effect of biofuel dedicated cropping in EU still relatively small, not very large difference with No-RED situation. • But environmental effect is expected to be much larger outside EU (cereal, sugar, soya, palm-oil demand). • Environmental effects of dedicated cropping with perennials could be diverse depending on stimulation methods. Abandoned lad option should be investigated further. June 2009- December 2011- EIE/08/653 30/4/2010 33
Cost-supply June 2009- December 2011- EIE/08/653 30/4/2010
Cost-supply France June 2009- December 2011- EIE/08/653 30/4/2010 35
Cost-supply Netherlands June 2009- December 2011- EIE/08/653 30/4/2010 36
Cost-supply Germany June 2009- December 2011- EIE/08/653 30/4/2010 37
Cost-supply Poland June 2009- December 2011- EIE/08/653 30/4/2010 38
Total cost-supply EU 2008 • Very large potential at very low price: • >50% industrial + household wastes, but now mostly unused or not for bioenergy • By-products agriculture (straw, prunings) June 2009- December 2011- EIE/08/653 30/4/2010 39
Conclusions • Largest cheap potential in waste. Improved organisation of collection, treatment, logistics will increase access to this resource • By-products from agriculture also have important potential, now still underutilized • Sustainability constraints on dedicated cropping are significant both inside and outside EU and will have important effects on economic availability • Forestry potential should be included. Will certainly add importantly June 2009- December 2011- EIE/08/653 30/4/2010
Future work • Draft results need further critical review and improvements • Scenario application to extrapolate present potentials to future technical-economic and sustainable potential • Forestry potential still to be included (updated EFI work) • Cuttings/pruning from landscape elements, recreational and nature conservation areas should still be mapped (but difficult) June 2009- December 2011- EIE/08/653 30/4/2010 41