Download
1 / 49
490 likes | 711 Vues
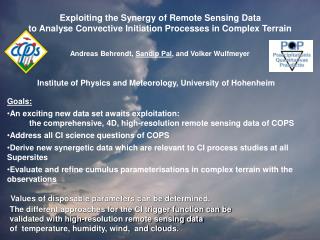
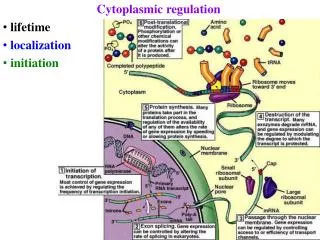
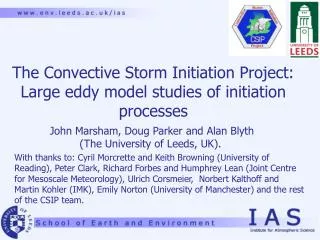
The Convective Storm Initiation Project: Large eddy model studies of initiation processes. John Marsham, Doug Parker and Alan Blyth (The University of Leeds, UK).

E N D
The Convective Storm Initiation Project:Large eddy model studies of initiation processes John Marsham, Doug Parker and Alan Blyth (The University of Leeds, UK). With thanks to: Cyril Morcrette and Keith Browning (University of Reading), Peter Clark, Richard Forbes and Humphrey Lean (Joint Centre for Mesoscale Meteorology), Ulrich Corsmeier, Norbert Kalthoff and Martin Kohler (IMK), Emily Norton (University of Manchester) and the rest of the CSIP team.
Talk Outline • Background - CSIP and its motivation • Two well forecast CSIP IOPs • Upper level forcing, coastal effects and cold pools • Process studies using the large eddy model (LEM)
Motivation • Poor forecasts of convective precipitation in the UK – especially initiation of convection • Flood prediction – extreme events • The new generation of high-resolution non-hydrostatic numerical weather prediction models • 1.5 km resolution for UK in 2010
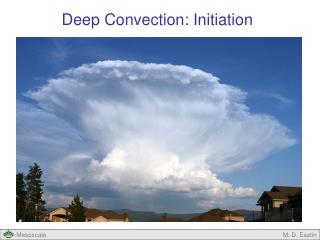
CSIP field campaign (2005) AberystwythMST Wind Profiler ReadingForecast Centre JCMMUFAM/Reading RadiosondeUFAM/Leeds Sodar 2 and AWSPotsdam GPS WV FaccombeUFAM/Salford Doppler LidarUFAM/Salford RadiometerSalford AWS 95 km range ring Met Office Cardington Mobile Radiosonde Facility BathIMK Radiosonde 2IMK Energy Balance station 2Potsdam GPS WV NERC Dornier 228(based in Oxford) Alice HoltUFAM/Leeds Sodar 1Potsdam GPS WV 40 km range ring LinkenholtUFAM/Aberystwyth Wind ProfilerPotsdam GPS WVMet Office RadiometerMet Office CeilometerMet Office Radiosonde LarkhillMet Office RadiosondePotsdam GPS WV ChilboltonUFAM/Reading 1275 MHz Radar35 GHz Radar3 GHz Radar905 nm LidarRadiometer (RAL)WV LidarUFAM/Aberystwyth Ozone LidarBath GPS WVUFAM/Leeds Sodar 3IMK Radiosonde 1IMK Energy Balance Station 1IMK Doppler Lidar 16 Leeds AWSs DunkeswellMet Office Wind Profiler ExeterMet Office Unified Model Forecasts HerstmonceuxMet Office Radiosonde SwanageUFAM/Aberystwyth Radiosonde Preston FarmUFAM/Leeds Radiosonde ThruxtonUFAM/Manchester CessnaIMK Dornier 128 CamborneMet Office RadiosondeMet Office Wind Profiler + + + + + + 200 km (Cyril Morcrette, University of Reading, 2006)
Processes of convective initiation • Coastlines and orography (<300 m in CSIP area, < 1500 m in UK) contrasts with IHOP and COPS regions
Results from CSIP • 18 Intensive Observation Periods (IOPs) • 7 “α” IOPs, 7 “β” IOPs and 4 “γ” IOPs • Convection originated above the boundary layer in only one IOP
IOP 1 Meteosat (visible) • Coastal convergence and a PV anomaly Meteosat: water vapour 200 km Radarrainrate 200 km 200 km
11 UTC Rainrates 1.5 km UM Radar (Cyril Morcrette (University of Reading), Pete Clark and Richard Forbes (JCMM)). • 1.5 km UM captures: • (1) Convergence along peninsula • (2) Storm deepening from upper level PV anomaly
Map of height of the capping inversion derived from 20 RHIs. The lid has been raised by the convergence line. Map of height of the capping inversion in 1.5 km version of the Met Office Unified Model. Cyril Morcrette, University of Reading, 2006
Effect of Dartmoor hills on final shower Normal Orography Without Dartmoor Rain rate (mm/hour) Rain rate (mm/hour) 12 UTC 1.5km model (Humphrey Lean, JCMM, Met Office, UK)
Downstream hole in cloud Cloud fraction: normal Orography Cloud fraction: without Dartmoor Cloud fraction Cloud fraction Humphrey Lean, JCMM, Met Office, UK
Downstream hole in cloud (Vis image) Humphrey Lean, JCMM, Met Office, UK
CSIP IOP 18 1.5 km UM 06Z from 12 km analysis Meteosat IR NIMROD Rain (Richard Forbes, JCMM) JCMM Joint Centre for Mesoscale Meteorology
JCMM Joint Centre for Mesoscale Meteorology IOP 18: Cold pool and bow echo(Richard Forbes and Peter Clark, JCMM) • The sensitivity to the model microphysics is being explored 7 K
Process Studies • Observational and large eddy modelling (LEM) studies to understand processes • Secondary initiation (pilot campaign case) • Role of cirrus shading (IOP 5)
The Met Office large eddy model (LEM) • 1D, 2D or 3D non-hydrostatic model • Bulk microphysics • Single moment cloud water & rain • Double moment ice, snow and graupel • Edwards-Slingo or Fu-Liou radiation • Periodic lateral boundary conditions
Pilot campaign: secondary initiation 08:45 UTC Could Arcs 2 and 3 have been triggered by a convectively generated gravity wave? Primary storm Arc 1 09:45 UTC Arc 1a Arc 1 Arc 2 150 km Arc 3 Primary storm (Observations from Morcrette et al, 2006). 150 km
Modelled Waves Potential temperature perturbations in large eddy model runs Tropopause Boundary layer depth N=1 N=2 N=2 N=1 Cold pool Wind N=3 N=3
Modelled effects of waves on CIN CIN at surface in LEM Arc 1 Arc 3 Arc 2 (Marsham and Parker, QJRMS, 2006) 9:15 UTC MSG image
Observed cloud and modelled CIN Contours: Modelled CIN • N=1 & N=2 mode inhibit convection. • N=3 mode initiates arcs.
Waves in the Unified Model Vertical velocities at 850 hPa in the Unified Model. (From Richard Forbes, JCMM, The University of Reading).
Summary 10th July 2004 case (pilot campaign) • The fastest waves inhibit convection • The slower N=3 mode initiates convection • We need a high-resolution non-hydrostatic NWP model to represent this, but implicit time-step of UM damps waves. • Initial results from the main CSIP campaign suggest that this case is by no means unique.
IOP 5 – Role of cirrus shading Pale blue: thin high cloud Pale green: low cloud White: thick high cloud ~ 200 km (Marsham et al, Parts I and II, submitted to QJRMS, 2006).
Radar rainrate IOP 5Role of cirrus shading Pale blue: thin high cloud MSG: 12:00 UTC (false colour) MSG: 13:00 UTC (false colour) Pale green: low cloud White: thick high cloud How significant is variable cirrus shading for convective initiation? ~ 200 km ~ 200 km
Questions to be addressed • What effect does cirrus have on surface fluxes? • Observations • What effect do surface flux variations have on convective initiation? • Observations and modelling • What effects do we see in the boundary layer (BL)? • Observations and modelling
Fluxes at Chilbolton 6 8 10 12 14 16 18 UTC (Surface flux data are from Ulrich Corsmeier, Norbert Kalthoff and Martin Kohler (IMK). Solar flux data are from The Chilbolton Facility for Atmospheric and Radio Research).
Observed surface sensible heat flux and solar irradiance Clear sky, 12:00 UTC ~ 200 W/m2 Cloudy sky, 12:00 UTC ~0 to 50 W/m2
Observed transmission and Meteosat infrared brightness temperatures (BTs) • So, Meteosat infrared BTs -> surface fluxes
Sensible heat fluxes from the 4 km Unified Model (UM data from Richard Forbes, JCMM, The University of Reading) Estimated surface fluxes Sensible flux estimated from visible MSG data Flux (W/m2) 0 50 100 150 200
LEM – moving warm anomaly Q2 Q1 Surface Pressure Heat added (Q) v D M.F F t=0 t=T Distance
Location of convective initiation 13:00 UTC (false colour) 200 km LEM results Cloud-top height: 1100 m, 1600 m, 3000m
Timing of convective initiation 12:00 UTC observations (D=25 km, v=15 m/s, M=4) • Straight line for: • No horizontal mixing • No convergence effects Time to level of free convection (1600 m) / hours Extra heat added by “hot spot” / unperturbed flux = (M-1)D/v
Observed convective initiation(Cyril Morcrette and Keith Browning, University of Reading) 11:30 UTC 12:00 UTC Rain Cumulus (26 tracks in total) Grey-scale infrared BTs at time of start of tracks (black= cold) • 25 start at rear edge of gaps/leading edge of cirrus/clear-sky • A significant fraction start near edge of 250 K cirrus-mask • 24 tracks start at BTs > 250 K
Effects on the boundary-layer • Profiles: • Radiosondes (one hour, ~50 km spacing) • Windprofiler (15 min) • Boundary-layer: • Aircraft (1 s, 60 m)
BL growth: Linkenholt windprofiler(Emily Norton, University of Manchester) Colours: TKE Contours: Potential temperature :Estimated Linkenholt surface fluxes Windprofiler TKE in LEM Colours: 1290 MHz windprofiler (Emily Nortin, University of Manchester) Contours: Chilbolton potential temperature : Chilbolton surface sensible heat flux (Windprofiler 20 km north of Chilbolton site) Time (UTC)
Effects of Cirrus on WVMR Infrared brightness temperature Infrared brightness temperature 300 K 300 K 240 K 240 K WVMR WVMR Aircraft (IMK Dornier-128) WVMR at ~500 m (colour) on Meteosat 11 μm BT (greyscale, black=cold)
Effects of cirrus on the BL • Drier, warmer and less turbulent under cirrus • Latent/sensible ratio increases with cirrus cover • Positive latent flux for zero sensible • Entrainment proportional to sensible flux • How does cirrus lead to drying?
LEM simulations3D, 5 km by 5 km, 50 m grid-spacing WVMR Contoured potential temperature. Coloured TKE Time (hours) Contoured potential temperature. Coloured WVMR Contoured potential temperature. Coloured WVMR TKE • TKE lags flux change more than WVMR Time (hours)
Time-dependence of the observed correlation between BL variables and the cirrus MSG-σ(w) MSG-MSG MSG- σ(wvmr) MSG-WVMR MSG-MSG MSG - σ(w) MSG-wvmr • WVMR is a faster response than σ(w) and σ(wvmr) MSG - σ(wvmr) Meteosat data before BL data Meteosat data after BL data
Drying at 500 m due to cirrus • (1a) Entrainment lags surface flux – dries upper boundary-layer (fast response) • (1b) Stable layer created at surface – traps moist thermals (fast response) • (2) Cirrus induces circulations (maximum at rear edge of cirrus)
Evidence of cirrus induced circulations Colours: WVMR Contours: potential temperature White line: Meteosat infrared BT 8 10 12 14 16
Pdfs of BL variables Cirrus (coldest 25% of Meteosat BTs) Clear-skies (warmest 25% of Meteosat BTs)
WVMR variations in the boundary-layer MSG: 1300 UTC, false colour + +
+ + Chilbolton profile Reading profile Can cirrus explain BL differences? Chilbolton flux • Simulation using Reading profile is always moister, whichever flux is used • Variable cirrus cover cannot explain this difference All contoured potential temperature, coloured WVMR Time (UTC) Time (UTC) Reading flux
Summary • Cirrus had significant effects on surface fluxes (factor of 4 or more) • Observed convective initiation consistent with LEM simulations i.e. in gaps/at leading edge of cirrus • Cirrus shading led to drying in mid-boundary layer (suppression of warm wet thermals) • Differences in cirrus not responsible for wetter boundary-layer at Reading
Conclusions (I) • Forecasting the larger scale is very important, but not sufficient, for forecasting initiation • High resolution (~ 1km) NWP capture many of the low-level forcings which dominate in the UK (coastlines and low hills) • Convergence from these frequently dominates the initiation. These are well resolved even if convection itself is not. • This also allows some surprisingly accurate forecasts of secondary initiation from cold pools
Conclusions (II) • Process modelling has allowed some more subtle mechanisms to be explored • Convectively generated gravity waves • Not well represented by the UM • Variable shading from cirrus anvils • Hard to forecast – a challenge for data assimilation • Complex effects on boundary layer • Difficult for a forecast model? • Pre-existing variations in WVMR are important
Ongoing work • Much of the datasets from July 2004 and June/July/Aug 2005 are unexplored • Role of upper level lids and dry layers • Primary initiation from cloud streets and thermals • Secondary initiation • Role of microphysics and extent of control on convective organisation • Warm rain