Download

1 / 45
450 likes | 558 Vues
This text explores the classification of goods and resources based on their excludability and rivalry. Key distinctions are made between private goods, public goods, common resources, and natural monopolies. Examples include city police services versus private security, fish in the ocean against farmed fish, and live versus televised concerts. The implications for economic theory and the free-rider problem in public goods are discussed, including concepts like marginal social benefit and cost, which are vital for determining efficient quantities in resource allocation.

E N D
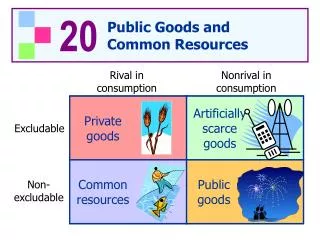
Classifying Goods and Resources • What is the essential difference between: • A city police department and Brinks security • Fish in the Atlantic Ocean and fish in a fish farm • A live concert and a concert on television • These and all goods and services can be classified according to whether they are excludable or nonexcludable and rival or nonrival.
Classifying Goods and Resources • Excludable • A good is excludableif only the people who pay for it are able to enjoy its benefits. • Brinks’s security services, East Point Seafood’s fish, and a Coldplay concert are examples. • Nonexcludable • A good is nonexcludable if everyone benefits from it regardless of whether they pay for it. • The services of the LAPD, fish in the Pacific Ocean, and a concert on network television are examples.
Classifying Goods and Resources • Rival • A good is rival if one person’s use of it decreases the quantity available for someone else. • A Brinks’s truck can’t deliver cash to two banks at the same time. A fish can be consumed only once. • Nonrival • A good is nonrival if one person’s use of it does not decrease the quantity available for someone else. • The services of the LAPD and a concert on network television are nonrival.
Classifying Goods and Resources • A Four-Fold Classification • Private Goods • A private good is both rival and excludable. • A can of Coke and a fish on East Point Seafood’s farm are examples of private goods. • Public goods • A public goodis both nonrival and nonexcludable. A public good can be consumed simultaneously by everyone, and no one can be excluded from its benefits. • National defense is the best example of a public good.
Classifying Goods and Resources • Common Resources • A common resourceis rival and nonexcludable. • A unit of a common resource can be used only once, but no one can be prevented from using what is available. Ocean fish are a common resource. • They are rival because a fish taken by one person isn’t available for anyone else. • They are nonexcludable because it is difficult to prevent people from catching them.
Classifying Goods and Resources • Natural Monopolies • In a natural monopoly, economies of scale exist over the entire range of output for which there is a demand. • A special case of natural monopoly arises when the good or service can be produced at zero marginal cost. Such a good is nonrival. If it is also excludable, it is produced by a natural monopoly. • The Internet and cable television are examples.
Classifying Goods and Resources • Figure 17.1 shows this four-fold classification of goods and services.
Public Goods • The Free-Rider Problem • A free rider enjoys the benefits of a good or service without paying for it. • Because no one can be excluded from the benefits is a public good, everyone has an incentive to free rise. • Public goods create a free-rider problem—the absence of an incentive for people to pay for what they consume.
Public Goods • The value of a private good is the maximum amount that a person is willing to pay for one more unit of it. • The value of a public good is the maximum amount that all the people are willing to pay for one more unit of it. • To calculate the value placed on a public good, we use the concepts of total benefit and marginal benefit.
Public Goods • Marginal Social Benefit of a Public Good • Total benefit is the dollar value that a person places on a given quantity of a good. • The greater the quantity of a good, the larger is a person’s total benefit. • Marginal benefit is the increase in total benefit that results from a one-unit increase in the quantity of a good. • The marginal benefit of a public good diminishes with the quantity of the good provided.
Public Goods • Figure 17.2 shows that the marginal social benefit of a public good is the sum of marginal benefits of everyone at each quantity of the good provided. • Part (a) shows Lisa’s marginal benefit. • Part (b) shows Max’s marginal benefit.
Public Goods • The economy’s marginal social benefit of a public good is the sum of the marginal benefits of all individuals at each quantity of the good provided. • The economy’s marginal social benefit curve for a public good is the vertical sum of all individual marginal benefit curves.
Public Goods • The marginal social benefit curve for a public good contrasts with the demand curve for a private good, which is the horizontal sum of the individual demand curves at each price.
Public Goods • The Marginal Social Cost of a Public Good • The marginal social cost of a public good is determined in the same way as that of a private good. • The Efficient Quantity of a Public Good • The efficient quantity of a public good is the quantity that at which marginal social benefit equals marginal social cost.
Public Goods • Figure 17.3 illustrates the efficient quantity of a public good. • With fewer than 2 satellites, MSB exceeds MSC. • Resources a can be used more efficiently by increasing the quantity.
Public Goods • With more than 2 satellites, MSC exceeds MSB. • Resources can be used more efficiently if fewer satellites are provided. • So the quantity at which MSB = MSC, resources are used efficiently. • Private production would produce 0 satellites.
Public Goods • Inefficient Private Provision • If a private firm tried to produce and sell a public good, almost no one would buy it. • The free-rider problem results in too little of the good being produced.
Public Goods • Efficient Public Provision • Because the government can tax all the consumers of the public good and force everyone to pay for its provision, public provision overcomes the free-rider problem. • If two political parties compete, each is driven to propose the efficient quantity of a public good. • A party that proposes either too much or too little can be beaten by one that proposes the efficient amount because more people vote for an increase in net benefit.
Public Goods • Figure 17.4 illustrates the efficient political outcome. • Two parties, Doves and Hawks, agree on everything except the number of satellites. • If Doves propose 1 satellites and Hawks propose 3, voters are equally unhappy and the election is too close to call.
Public Goods • If Doves increase the number of satellites to 2, it will win the election if Hawks propose 3. • If Hawks decrease the number of satellites to 2, it will win the election if Doves propose 1. • Both parties propose 2 satellites and each party gets 50 percent of the votes.
Public Goods • Principle of Minimum Differentiation • The attempt by politicians to appeal to a majority of voters leads them to the same policies—an example of the principle of minimum differentiation. • The principle of minimum differentiation is the tendency for competitors to make themselves similar so as to appeal to the maximum number of clients (voters). • (The same principle applies to competing firms such as McDonald’s and Burger King).
Public Goods • Inefficient Public Overprovision • If competition between two political parties is to deliver the efficient quantity of a public good, bureaucrats must cooperate and help achieve this outcome. • Objective of Bureaucrats • Bureaucrats want to maximize their department’s budget. • A bigger budget increases their status and power. • Bureaucrats might try to persuade politicians to provide more than the efficient quantity.
Public Goods • Rational Ignorance • Rational ignorance is the decision by a voter not to acquire information about a policy or provision of a public good because the cost of doing so exceeds the expected benefit. • For voters who consume but don’t produce a public good, it is rational to be ignorant about the costs and benefit. • For voters who produce a public good, it is rational to be well informed. • When the rationality of uninformed voters and special interest groups is taken into account, the political equilibrium results in overprovision of a public good.
Public Goods • Figure 17.5 shows bureaucratic overprovision. • If rationally ignorant voters enable the bureaucrats to achieve their goal of maximizing their budget, • public good might be overprovided and • and a deadweight loss created.
Public Goods • Two Types of Political Equilibrium • The two types of political equilibrium—efficient provision and inefficient overprovision of public goods correspond to two theories of government: • Social interest theory predicts that political equilibrium achieves efficiency because well-informed voters refuse to support inefficient policies. • Public choice theory predicts that government delivers an inefficient allocation of resources—that government failure parallels market failure.
Public Goods • Why Government Is Large and Grows • Two possible reasons are • Voter preferences • Inefficient overprovision • Government grows because the voters’ demand for some public goods is income elastic. • Inefficient overprovision might explain the size of government but not its growth rate.
Public Goods • Voters Strike Back • If government grows too large relative to the value voters place on public goods, there might be a voter backlash that leads politicians to propose smaller government. • Privatization is one way of coping with overgrown government and is based on distinguishing between public provision and public production of public goods.
Common Resources • The Tragedy of the Commons • The tragedy of the commons is the absence of incentives to prevent the overuse and depletion of a commonly owned resource. • Examples include the Atlantic Ocean cod stocks, South Pacific whales, and the quality of the earth’s atmosphere. • The traditional example from which the term derives is the common grazing land surrounding middle-age villages.
Common Resources • Sustainable Production • Sustainable production is the rate of production that can be maintained indefinitely. • This production rate depends on the existing stock of fish and the number of boats that go fishing. • For a given fish stock, as more boats go fishing, the quantity of fish caught increases. • But with too many boats fishing, the quantity of fish caught decreases.
Common Resources • Table 17.1 illustrates the number of boats and the quantity if fish caught. • As the number of fishing boats increases, the quantity of fish caught increases to some maximum. • Overfishing occurs when the maximum sustainable catch decreases.
Common Resources • Table 17.1 also shows the average and marginal catch depends on the number of boats that go fishing. • As the number of fishing boats increases: • The average quantity of fish caught decreases. • The marginal catch decreases.
Common Resources • Figure 17.6 illustrates the sustainable production of fish. • As the number of fishing boats increases, the quantity of fish caught increases to some maximum. • Overfishing occurs when the maximum sustainable catch decreases.
Common Resources • An Overfishing Equilibrium • Figure 17.7 shows why overfishing occurs. • Marginal private benefit, MB, is the average catch per boat. • Marginal private benefit decreases as the number of boats increases. • The marginal cost per boat is MC (assumed constant).
Common Resources • Equilibrium occurs where, MB equals MC. • In equilibrium, the resource is overused • because no one takes into account the effects of her/his actions on other users of the resources.
Common Resources • The Efficient Use of the Commons • The quantity of fish caught by each boat decreases as the number of boats increases. • But no one has an incentive to take this fact into account when deciding whether to fish. • The efficient use of a common resource requires marginal social cost to equal marginal social benefit.
Common Resources • Marginal Social Benefit • Marginal social benefit is the increase in the total fish catch that results from an additional boat. • Marginal social benefit equals the marginal catch of a boat, not the average catch per boat.
Common Resources • Efficient Use • Figure 17.8 shows the marginal private benefit curve, MB, andthe marginal social benefit curve, MSB. • With no external costs, the marginal social cost MSC equals marginal cost MC. • Resources are used efficiently when MSB equals MSC.
Common Resources • Achieving an Efficient Outcome • It is harder to achieve an efficient use of a common resource than to define the conditions under which it occurs. • Three methods that might be used are • Property rights • Production quotas • Individual transferable quotas (ITQs)
Common Resources • Property Rights • By assigning property rights, common property becomes private property. • When someone owns a resource, the owner is confronted with the full consequences of her/his actions in using that resources. • The social benefits become the private benefits. • But assigning property rights is not always feasible.
Common Resources • Production Quotas • By setting a production quota at the efficient quantity, a common resource might remain in common use but be used efficiently. • Figure 17.9 shows this situation. • It is hard to make a production quota work.
Common Resources • Individual Transferable Quotas • An individual transferable quota (ITQ) is a production limit that is assigned to an individual who is free to transfer (sell) the quota to someone else. • A market in ITQs emerges. • If the efficient quantity of ITQs is assigned, the market price of an ITQ confronts resource users with a marginal cost of MC + price of ITQ. • With MC + price of ITQ equal to MSB, the quantity produced is efficient.
Common Resources • Figure 17.10 shows the situation with an efficient number of ITQs. • The market price of an ITQ increases the marginal cost to MC0 + price of ITQ. • Users of the resource make MB equal MC0 + price of ITQ, and the outcome is efficient.
Common Resources • Public Choice and Political Equilibrium • It is easy for economists to agree that ITQs make it possible to achieve an efficient use of a common resource. • It is difficult to get the political marketplace to deliver that outcome. • In 1996, Congress killed an attempt to use ITQs in the Gulf of Mexico and the Northern Pacific Ocean. • Self-interest and capture of the political process sometimes beats the social interest.