Download

1 / 55
550 likes | 717 Vues
WHAT IS NEXT FOR COMMODITY AND FOOD PRICES ?. Alex F. McCalla, Professor Emeritus, UC Davis U of A International Week Edmonton, February 5, 2009. Why Are We Talking about This Question ?. Because of What has Happened to Ag. Commodity Prices over the Past 3 Years; First They Sky Rocketed Up;

E N D
WHAT IS NEXT FOR COMMODITY AND FOOD PRICES ? Alex F. McCalla, Professor Emeritus, UC Davis U of A International Week Edmonton, February 5, 2009
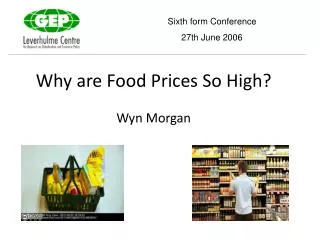
Why Are We Talking about This Question ? • Because of What has Happened to Ag. Commodity Prices over the Past 3 Years; • First They Sky Rocketed Up; • Now They are Crashing Down; • Because of Food Price Inflation; • Because of Food Riots in 30+ Poor Countries; • First Let’s Look at What Happened- • And Then Try to Put it in Historical Context • Then Turn to The Question
The Historical Context • Since 1870’s LR real grain prices have been declining except for periodic price spikes. • What do the dates 1910-14, 1972-74 and 1995-96 have in common? • They were price spikes after which real prices returned to the previous downward trend. • Therefore one basic question is- when this spike is over will the LR trend revert or be higher? • Will Show You 4 Pictures
Index of real corn and wheat prices, 1866-2008 Sources: Carter, et al. editors (2006), USDA NASS Agricultural Prices, USDA WASDE and BLS “CPI- All Urban Consumers. Quoted in Sumner (2008)
200 150 100 50 0 Corn Wheat Expon. (Wheat) Expon. (Corn) 1952 1976 19741. Index of Real Corn and Wheat Prices and Long-Term Trend 1972 1970 1968 1966 1964 1962 1960 1958 1956 1954 1948 1950Figure s, 1948–2008 1994 1992 1990 1988 1986 1984 1982 1980 1978 2006 2004 2002 2000 1998 1996 2008 Index of Real Corn and Wheat Prices and Long term Trend -1948-2008 (from Sumner 2008)
Declining Real Prices of Grains and Soybeans (2000 US$) 1960-2008 USDA deflated prices from Meyers & Meyer, Dec 2008
Short Answer the Question –Nobody Knows for Sure- But We Can Identify Critical Factors • Outline Of Where We Are Going: • What Prices and Markets are we talking about? • Will Set Global Context; but • Will Focus on Basic Food Products esp Grains; • A Look at Market structure • Is There a Consensus on What Caused the Price Spike? No • What are the Candidates? • Is There a Consensus on Where Prices Will Go in the Future? No- • What are the Possibilities? • Why is it so Complicated and When Will We Know what will be the Future of Food Prices?
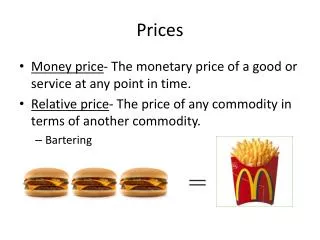
What Prices and Markets are we talking about? • Agricultural Products Can Be Grouped into 3 Parts • Livestock & Livestock Products- • Milk & Milk Products- butter, cheese, powder; • Meat – beef, pork, sheep, poultry; • Fiber- wool • Annual/ Field Crops- • Fiber- cotton, flax; • Cereals- Big 3-- rice, wheat, maize—also coarse grains • Vegetables; • Oilseeds- soya, canola • Perennial Crops- • Oil Trees- palm, coconut • Beverages- coffee, tea, cocoa • Fruits
What Prices and Markets are we talking about? -2 • Markets However Are Not All The Same- • They differ by what share of global production enters international markets –share traded; • If Small Share is Traded, Markets are “thin” • Whether Major Producers are the Same as Major Traders? • Degree of Concentration: Among Exporters? Among Importers? • The Nature of Trade and Production Policies Applied by Major Players
What Prices and Markets are we talking about? -3 • Share Traded- • high for tropical products – palm oil 74%,coffee 73%, cocoa 77%,tea 50% -also about 50% for wool; • 20 – 50 % - vegetable oils- soy & canola; • 10 – 20% - wheat(18), cotton (12), meat (10); • < 10 % -rice (6), milk products, fresh vegetables and fruits < 5%; • Not traded –roots and tubers, pulses • Where Share is High, Big Producers are Big Traders too- not Necessarily True in Thinner Markets • Therefore Market Structure Matters.
Focus Will be on Grains & Oilseeds • Not Time to Talk of All Markets so Will Focus on Grains & Oilseeds Given Where we are- • Specifically on Wheat, Rice, Maize/corn and Oilseeds; • Will be Looking at Market Structure and International Price Behavior; • Will Make Occasional Comparison to Coffee Market
World Market Structure – Milled Rice Major Producers mmt 2007/08 Major Exporters mmt 2007/08 • China 130.2 • India 96.4 • Indonesia 35.8 • Bangladesh 28.8 • Vietnam 24.4=73% • USA 6.3 • WORLD 431.3 • Thailand 10.0 • Vietnam 4.6 • USA 3.5 • Pakistan 3.0 • India 2.9 =82% (top 5 importers 28.2%) • WORLD 29.2 6.8% of Pdn Traded
World Market Structure-Maize/Corn Major Producers mmt 2007/08 Major Exporters mmt 2007/08 • USA 331.2 • China 152.3 • Brazil 58.6 • EU 47.7 • Mexico 22.4=83% • WORLD 791.5 • USA 60.8 • Argentina 15.6= 80% • Brazil 7.9 • Ukraine 2.1 • S. Africa 1.1= 91% (top 5 importers 56%) • WORLD 96.0 %12 of pdn traded
World Market Structure -Wheat Major Producers MMT-2007/08 Major Exporters MMT- 2007/08 • EU 119.4 • China 109.2 • India 75.8 • USA 55.8 • Russia 49.4 = 67% • Pakistan 23.3 • Canada 20.1 • WORLD 610.2 • USA 34.5 • Canada 16.6 • EU 12.2 • Russia 12.2 • Argentina 10.2 =74% (top 5 importers 29%) • WORLD 115.5 • 18.7% of Pdn Traded
World Market Structure- Soybeans Major Producers mmt 2007/08 Major Exporters mmt 2007/08 • USA 72.9 • Brazil 61.0 • Argentina 46.2 • China 14.0 • India 9.3=92% • WORLD 220.9 • USA 31.6 • Brazil 25.4 • Argentina 13.8 • Paraquay 5.1 • Canada 1.8=98% (top 5 importers 80%) WORLD 79.5 36% of Pdn is traded
For Comparison-Coffee Market Major Producers- m. 60kg bags 2007/08 Green Coffee Beans Major Exporters m 60kg bags 2007/08 Green Coffee Beans • Brazil 37.6 • Vietnam 18.3 • Colombia 12.4 • Indonesia 6.7 • Ethiopia 5.0=66% • WORLD 120.9 • Brazil 23.8 • Vietnam 16.0 • Colombia 10.9 • Indonesia 4.6 • Guatemala 3.8=66% (top 5 Importers 86%) WORLD 89.0 74% of pdn is traded
What Should We Learn From Market Structure ? • 1. Markets are very different- • Rice- very thin market (6% traded);smallest top 5 producer is only one in top 5 traders; exporters & producers highly concentrated, importers not so; two countries produce ½ of world’s rice; • Corn- only 12% traded(thin),largest producer is also largest trader(US);production and trade highly concentrated –pdn top 2=61%-trade top 2=80%. • Wheat- higher share traded; concentration in pdn & trade lower; importer concentration low and same as rice. • Soybeans-over 1/3 of pdn traded; production and exports highly concentrated in same three countries; importer concentration also high. • Coffee-3/4 of production is traded therefore top producers are also top exporters; 2 importers import 55% of coffee imports; is a highly concentrated market with trade dominating.
What Should We Learn From Market Structure ? -2 • The size of larger producers and traders matters because big players can influence world prices by both domestic and trade policies • If big producers and big traders are the same and the market is concentrated would tend to be more stable unless there was a price war; • Thin markets where big producers are not big traders means changes in domestic policy can have big consequences for world markets. These markets are inherently more unstable; • Individual markets are not necessarily homogenous-japonica, indica and basmati are all called rice but are very different; hard red spring wheat is not a substitute for soft white winter wheat. • Yellow maize is predominantly animal feed ,white maize is human food, underlining differing demands for same commodity • The bottom line is that one might expect these markets to behave very differently.
But Markets are Linked in Many Ways • Yet in a broader sense individual agricultural commodity markets are linked in many ways; • Substitution in consumption: wheat for rice and maize; wheat for animal feed if feed grain prices rise relative to wheat prices but it is asymmetrical; among vegetable oils and meals. • Competition/substitution in production: along a continuum there is substitution between corn and soybeans, corn and wheat, canola, wheat and coarse grains-etc.etc. 12 mil acres shifted from soybeans to corn in US in 2007/08 • Demand for all commodities is driven by population and income growth. • And domestic and trade policies often treat groups of commodities as one.
Commodity Markets in the Broader Context • Agricultural commodity markets are parts of a broader set of primary products markets-petroleum, metals, minerals and forest products. These all may be influenced exchange rate changes, inflation, recession etc • Ag. Commodities are also real assets whose value as a store of wealth changes with the impacts of inflation/deflation on monetary assets. They have become part of index and hedge funds. • Finally globalization with closer and faster linkages between real and financial markets world wide means ag commodity markets exist in a complex maze of inter-related and often conflicting forces.
What Caused the Spike? • There are at least 4 competing stories floating around: • Macro story-It is a commodity spike –oil, minerals (including gold), ag commodities prices skyrocket together and fell together- therefore must be macro explanation; • Declining $US pushes up global commodity P.’s which are denominated in $- When US$ appreciated in last ½ of 2008 commodity prices collapsed. Low real interest rates reduced costs of storage therefore investors shift into real commodities. Speculator story- in periods of uncertainty/decline, investors shift to real assets –rapid rise in hedge and particularly index fund investments in commodities, fund investors are very long in commodity markets. But as futures and hedge fund contracts expired investors sold heavily driving prices.This might help explain the magnitude of the volatility of the spike but not sustained price increases
Changes in Futures Market Players 29 Source: Corn Futures Net Positions from CFCT (COT) reports; Quoted in Carter et al. 2008
What Caused the Spike?-2 • Shocks story- three years of drought in Australia, poor crops in Europe, Canada and US in 2007 drew down stocks below critical levels. The explosion of Biofuels demand coupled with reduced supply caused big Price increases. • Structural Change/Shock story- this is the one most ag commentators have focused on. Fast income growth India, China etc driving demand growth faster and supply growth slowing. Common to first three is –P increases temp. then back to normal. Fourth involved permanent changes and was the popular story among ag. Economists-but prices came back down
Structural Change plus Shocks • An Amazing # of analysts who identified a similar set of causes, differed only on relative impacts. • IFPRI, WB, IMF, USDA/ERS, FAO, OECD, Govt. of Australia, WSJ, NY Times, ad infinitum all see structural change in S & D which are pushing ag. Commodity prices up. • When perturbed by shocks or rapid shifts in parameters, price increases are magnified. • Implication --real prices after the blip should be permanently higher.
Structural Change plus Shocks-2 • IFPRI is representative of an great consistency among Agricultural Economic analysts: • Demand side factors; • Rapid growth & rising incomes in emerging developing countries e.g. India and China has increased the rate of demand expansion; • Bio-fuel demand came on fast and hard pushing the D curve out even faster; • Urbanization and globally rising incomes mean demand for more and different mix of food.
Shares in Growth of Grain Consumption 2005/06-2007/08 from Meyers & Meyer,2008 Source: Calculated from PSD database, USDA.
BioFuels Boom Ethanol production 1975 - 2007 (billion liters) Ethanol > 90% of biofuel production; Brazil and US dominate the market Biodieselproduction 1991 - 2007 (billion liters) Biodiesel: EU is the largest producer and consumer Source: Global Subsidies Initiative 2007
Structural Change plus Shocks-3 • Supply Side factors- • Rate of increase in supply has slowed in last decade because of slower productivity growth and increased competition for land and water; • Rising petroleum prices have irreversibly increased cost of production. The result has been global consumption exceeding global production in 7 of the last 8 years. Global stocks have fallen to the lowest level since early 1970’s. IFPRI has an interesting set of slides on these factors.
Productivity growth is declining Source: World Development Report 2008.
Higher input costs: Global fertilizer prices tripled in 2007 800 World Fertilizer Prices, 2000-2008, US$/mt 700 600 DAP, US Gulf 500 400 300 200 100 MOP, Vancouver Urea, Arab Gulf, prilled 0 Jan-07 Jan-08 Jan-00 Jan-01 Jan-02 Jan-03 Jan-04 Jan-06 Jan-05 Source: IFDC 2008.
Which Causes Were More Important? • Despite all the “analysis” there have been precious few empirical estimates as how much each cause contributed. • Re Biofuel impacts- wide range: IFPRI -30% of past increases , 18-25% more by 2020 if demand continues to increase; Andy Stoeckel (Australia) argues diversion of 38% of US corn crop to ethanol has significant price impact (no number) but US Ag Sec says ethanol demand only contributed 3% to overall 42% anticipated food price increase. • Re Increased costs of petroleum based inputs-+ 15% says World Bank.
Which Causes Were More Important? 2 • Decreased investment in Agricultural R&D and general neglect of agricultural development over the past two decades no doubt slowed up productivity growth. • Stock to use ratios falling below 0.15 have in the past been associated with price spikes e.g. 72-74. • The consensus appears to be that entry of new players such as index funds will have little long run effect. • Without question bad policies have exacerbated the price spike- Export embargoes, increased export taxes and attempting to build stocks.
The Stocks / Shock Story • The Fact that Grain Consumption Exceeded Production 6 out of 8 years after 2000 drew down stocks sharply to levels below 1972-73. • At a critical point as stocks fall, players in the market change behavior and hold or acquire stocks, the result given highly inelastic demand in the SR drives prices up rapidly ( Brian Wright) may explain run up but not the down. • But question was what would happen to prices after the bubble broke? • Most projections forecast higher Real Price after the peak- a sampling here- OECD and FAPRI. • IFPRI and the World Bank had similar projections. • But Current prices are already below their projections
Expected world commodity prices for the coming decade- OECD Source: OECD-FAO (2008).
OECD-FAO Projections: Wheatfrom Meyers and Meyer OECD-FAO Agricultural Outlook, 2008-2017
FAPRI Projections of US Crop Prices from JanPrices from January 2008 Actual wheat prices were 2008 US$ 12.4 per Bushel in March and less than US$ 5 per Bushel in early Dec. 2008
Consequences: Depends On- • Before looking at future let’s look at impacts of price spike. • If Country -depends on: • - exporter or importer; • - high or low income; • - degree of dependence on world markets; • - degree of P pass through to Prod &/or Con. • - worst case- low income, high dependency, high grain consumption - North Africa and Middle East. • If Person -depends on: • Consumer or producer ? Of grains or livestock? • High pass thru -bad for consumers, good for grain producers • Low pass thru –bad for government fiscal and foreign Ex budgets
Consequences: An Example High Income Low Income Base Case: Income/yr $40,000 $800 % spent on food $4000(10%) $400 (50%) Staples as% of food 20%-$800 70%-$280 50 % inc. in staple p: New staples cost $1200 $420 New Total food costs $4400 $540 New % Spent on Food 11%67.5%
Impacts on Food Prices& Inflation • Therefore impacts on food prices depends on: • Share of commodity price in final product- e.g. wheat cost < 10% cost of bread, polished rice =50%; • Whether commodity is an input into another food product- grain into dairy and meat production; • Share of income spent on food; if high food price increases reduce real income- in example the poor consumer has $140 less to spend on other things; • Re Inflation –share of food & ag industry in GDP
What Were the Consequences • The consequences for poor net importing developing countries are severe. • Rising foreign exchange costs for imports, particularly bad if not an oil exporter; e.g Tunisia, Jordan,Yemen –respectively import 53, 65 & 76% of their cereals; • Rising fiscal costs of domestic feeding programs- for Tunisia estimated increase $200 Mil. to $1 Bil.; • Countries pushing back towards inefficient self-sufficiency because don’t trust world markets; • World Bank estimates pushed 100 mil people into poverty; • Created political and social unrest. Plus side if prices passed to poor farmers, good for food security and poverty reduction.
Food price related protests 2007-2008 1 Argentina 2 Bangladesh 3 Burkina Faso 4 Cameroon 5 China 6 Cote d'Ivoire 7 Egypt 8 Ethiopia 9 Guniea Haiti Honduras 11 India 12 Indonesia 13 Italy 14 Jordan 15 Madagascar 16 Malaysia 17 Mauritania 18 Mexico 19 Morocco Mozambique Pakistan 21 Philippines 22 Senegal 23 United Kingdom 24 Uzbekistan 25 Yemen
What Has Happened Since Bubble Broke? • Wheat- 2008/09 record crop 683 mmt +12%: • Record yields and + 3% Acreage; • Stocks up from record low of119.4mt to 148.4 mt • Rice- 2008/09 record crop 439 mmt ,stocks up 2%: India and Egypt continue export bans: • Coarse grains -3% increase in production • EU wheat production up 30mmt, coarse grain production up 24 mmt; • There has been a supply response except in Australia.