Download
1 / 21
210 likes | 324 Vues
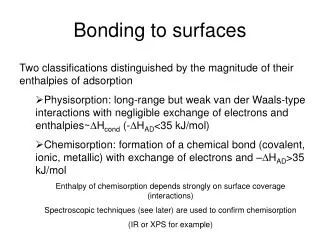
ELM fluxes to ITER surfaces – issues in extrapolation. GF Counsell, UKAEA. Geometry transport // transport Radiation Asymmetry. Material properties. Erosion Damage. ELM fluxes.

E N D
ELM fluxes to ITER surfaces – issues in extrapolation GF Counsell, UKAEA
Geometry • transport // transport Radiation Asymmetry Material properties Erosion Damage ELM fluxes Reality – predictions for ELM fluxes in ITER are not the point. We are actually specifying the degree of ELM mitigation required
Laboratory tests have helped set limits on energy density for ITER targets Eden < 0.5MJ/m2 consistent with planned operations • Limits may be determined by melting or ‘structural damage’ • Both total energy density and its evolution may be important A. Zhitlukhin et al JNM 363 (2007) 301 ELM heat pulse dynamics not well simulated possible consequences for estimated limits?
Geometry Transport ….or Asymmetries Radiation
in existing devices are small – < 40% AUG, <20% in MAST fR: Radiated power fractions J.C. Fuchs, AUG ‘Steady-state’ radiated power fraction in ITER 70% - 80% ELM volumetric power densities are much higher -
fLFS: in-out asymmetry T.Eich, AUG fLFS (=Ein/Etot) < 2/3 in AUG data but broad scatter Empirical approach only, no theoretical understanding. Risk of systematic errors? Difficult to reconcile results with // transport and total energy balance MAST cDND results: - consistent with B drift Could fLFS = 2/3 be too conservative? T.Eich (A. Kirk)
lH & fELM : heat flux widths A. Herrmann, AUG A. Kirk, MAST AUG: 1 < fELM (= ELM/i-ELM) < 3 MAST: fELM ~ 1
Div I Div II D. Whyte A. Kallenbach lH & fELM : heat flux widths Inter-ELM SOL heat-flux width – biggest uncertainty Multi-variate scalings traditionally have little success Divertor can affect scalings - even on a single device Herrmann, AUG • Perhaps some success with Te • But: • Scatter still large • Extrapolation to target uncertain • Doesn’t encompass ions
Alternative/complementary picture of transport (i,e) Filamentary structures are ubiquitous in MAST edge In ALL regimes
Filaments dominate the particle flux to mid-plane reciprocating probe across SOL R. Scannell, MAST
No first wall interactions in MAST Filament energy deposited at target
ELM filaments have 2 phases: • ‘Connected’ to separatrix for • t ~ tMHD • Separated and moving radially measured in MAST & AUG Simple model – determined by // losses from connected filament A. Kirk, AUG Good fit to near-SOL l A. Kirk, MAST
ELM fluxes to the wall Heat flux in far SOL determined by radial motion of filament and // losses Starting point follows connected phase – ~25% DWELM remaining A. Herrmann, AUG Typical mode number – 8 < n < 12 ~2.5% DWELM per filament
A. Kirk, MAST increases with Tped (hence Tfil) But at high Tped, nfil should decrease more quickly shorter l Unless filament is accelerating …. Analysis of individual ELM filament motion clearly suggests acceleration -
A. Kirk, MAST Acceleration increases with DW/Wped Best fitted by – ar (DW/Wped)0.25(dashed red) MAST data doesn’t support model with constant vr/cs, increasing with DW/Wped
// currents limited by jsat at divertor plates Unable to ‘short-circuit’ B driven current in filaments Only component of jpol of ambient plasma contributes to short-circuiting Magnetic shear amplifies this, near X-point strong E formed Result – ar= 2(Ti,f+ Te,f)/miR Predicts for MAST ar~2.5x10⁸m/s2 (1.8x10⁸m/s2 measured) ITER (filament from 1MJ ELM) predicts ar~6.6x10⁷m/s2 Rozhansky, PPCF 08
A. Kirk, MAST Model clearly not exact - ar= ainitial + 2(Ti,f+ Te,f)/miR ainitial~ 1.3x10⁸ m/s2 - Could be associated with initial ‘explosive’ non-linear growth phase of filament?
Simple Monte-Carlo model of filament to predict ITER fall of lengths in nf and Ti,f Models evolution of particle distribution function with // losses and evolving ar
AUG Extrapolating to ITER power/energy loads Must ‘launch’ filaments with energy after ‘connected’ phase losses Upper target heat flux profile/evolution needs careful modelling of magnetic geometry, v, ar and // losses Radial motion stops after contact with significant limiting surface Very high q// on edges during t ~ d///cs ~ 200 ms
Conclusions • Max DWELM estimates are pretty robust • Issues – ELM heat pulse dynamics in lab simulations • Basis for heat flux width • In-out ELM energy distribution • Alternative assumptions give range 1MJ – 2.5MJ. Still very small • ELM wall deposition less robust • Issues – Initial ELM conditions at separation • Mode number & dimensions • Model for radial expulsion – hence vr, ar • Need for accurate modelling of upper target loads (helical stripes) and limiter interactions • Very probably Eden not an issue, even for 2.5MJ ELMs. Impurity influx could be an issue? (ions still hot)