Download
1 / 21
210 likes | 375 Vues
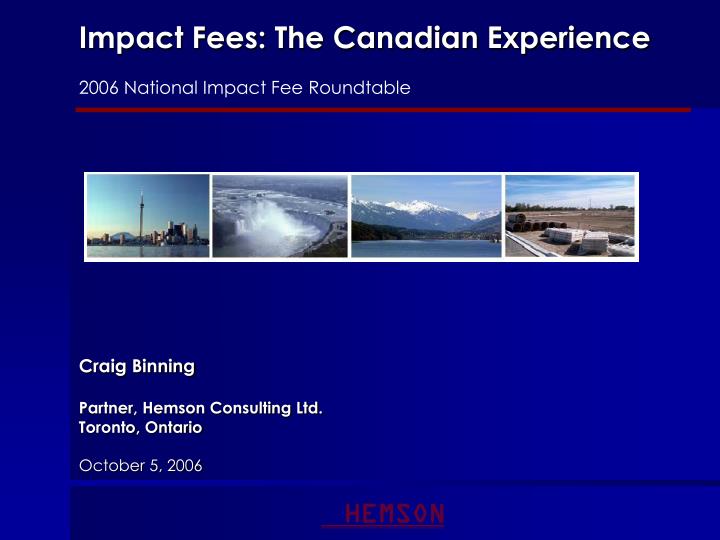
Impact Fees: The Canadian Experience 2006 National Impact Fee Roundtable Craig Binning Partner, Hemson Consulting Ltd. Toronto, Ontario October 5, 2006. TODAY WE WILL DISCUSS:. Growth Pressures in Canada A Brief History of Development Charges in Canada Overview of Practices Across Canada

E N D
Impact Fees: The Canadian Experience 2006 National Impact Fee Roundtable Craig Binning Partner, Hemson Consulting Ltd. Toronto, Ontario October 5, 2006
TODAY WE WILL DISCUSS: • Growth Pressures in Canada • A Brief History of Development Charges in Canada • Overview of Practices Across Canada • The Ontario Experience and Practice • Emerging Issues
CANADA IS GROWING • Over the last decade Canadian urban centres, especially the Greater Toronto Area, have experienced significant levels of growth • Looking forward: • The Greater Toronto/Golden Horseshoe will add 3.7 million people by 2031 • The Province of Alberta is currently experiencing the fastest rates of economic growth in North America • The population of the Greater Vancouver Area is forecast to increase by 1/3 by 2031
1990 - 2001 POPULATION GROWTH RATES 10 Largest CMSA's Canada-U.S. Dallas-Fort Worth Toronto-Hamilton Los Angeles-Riverside Washington-Baltimore San Francisco-San Jose Chicago New York-Northern NJ Boston Detroit Philadelphia 0% 0.5% 1% 1.5% 2% 2.5% Growth Rate Source: Hemson Consulting Ltd. based on Statistics Canada and the US Bureau of the Census Note: To allow comparison the Toronto-Hamilton area is based on applying the US Census definition for a Consolidated Metropolitan Statistical Area to Toronto. This area would include the GTA, Hamilton, Barrie and surrounding areas but not Niagara, Guelph, or Waterloo Region. GTAH IS ONE OF THE FASTEST GROWING REGIONS IN NORTH AMERICA
GROWTH IN CANADA IS HIGHLY CONCENTRATED 1996-2001 POPULATION GROWTH Growth (000s) 800 600 400 200 0 -200 Toronto-Hamilton-Waterloo Vancouver-Victoria Calgary-Edmonton Montreal Ottawa-Gatineau Rest of Canada Source: Hemson Consulting based on 2001 Census, Statistics Canada Note: These areas are based on Hemson's "urban field" analysis and are much larger areas than the typical metropolitan area definitions
A LITTLE BIT OF HISTORY • The 70’s and 80’s: • Rapid growth – significant greenfield development • Demand for infrastructure/capital facilities • Mounting debt burdens – municipalities with over 30% of net tax levy in debt charges = loss of flexibility • Upward pressure on municipal tax rates • Development of pro-growth & anti-growth factions • Many municipalities passed first substantial all encompassing lot levy policies and rates
THE 1990’s: THE DOWNLOAD • Provincial Governments throughout Canada Began to Shift Servicing Delivery to Municipalities • Limited New Revenue Raising Tools Provided to Municipalities • Many Provinces Enacted “Development Charge” Legislation: • Formalized municipal authority to collect capital contributions charges from new development • Set out restrictions (i.e. services that could be recovered for, etc.), calculation rules, etc.
OVERVIEW OF CANADIAN LEGISLATION • Most Provinces Allow for the Levying of Development Charges (DCs) • The Most Permissive Legislation Is in Ontario and British Columbia: • Allows for recovery of most municipal services • Other Provinces Typically Recover for “Hard” Services (Water, Sewer, Drainage and Roads) and Sometimes Recreation • Municipalities in Quebec, and in Particular Montreal, Fund Growth-Related Infrastructure from Property Taxes and User Rates
Ontario Development Charges Act, 1997 • A Background Study and Public Process Is Required • A By-Law Must Be Enacted (Maximum Life Is Five Years) • Restriction on Services That Can Be Included and the Level of Growth-Related Capital Costs Recovered
Ontario Development Charges Act, 1997 • Restriction on capital costs • Computers excluded and vehicles with a useful life less than 7 years • Intensification Exemptions • Charges restricted to 10 year historic service level averages
100% Cost Recovery Protection Services: Fire Services Police Services Engineered Services Roads & Related Water Sanitary Sewage Stormwater 90 % Cost Recovery Library Parks and Trails Indoor Recreation Public Works Buildings & Municipal Fleet Parking Other SERVICES ELIGIBLE FOR RECOVERY: SERVICE INCLUSIONS:
INELIGIBLE SERVICES: • Some Services Excluded from Development Charges: • Cultural and Entertainment Facilities (museums, theatres, galleries) • Tourism Facilities including convention centres • Parkland Acquisition • Hospitals • Headquarters for General Administration of Municipalities and Boards • Waste Management • Other Services prescribed by Regulation
HIGHLIGHTS OF THE ONTARIO LEGISLATION • Charges can be municipal-wide and area-specific • Dedicated reserve funds are required • Credit and “front ending” agreements are permitted • Charges can be levied on residential and non-residential land • Companion act legislates school board charges
NEXT DIRECTIONS AND AREAS OF INTEREST • Correlation Between Development Charge Policies and Municipal Planning Objectives • Downtown revitalization & brownfield development • Intensification • Increased Use of Area-Specific Charges • Alignment of costs and demand for services (Smart Growth) • Facilitation of front-ending and cost sharing agreements
DOES GROWTH PAY FOR GROWTH? • Development Charge Shortfalls: • Legislative exemptions • 10% service discounts • 10 year historic service level restriction • The transit issue • Non-statutory exemptions & reductions • Capital cost increases beyond indexing
Questions? Hemson Consulting Ltd. www.hemson.com