Understanding Early Years Foundation Stage Profiles: Key Insights and Data Analysis
60 likes | 167 Vues
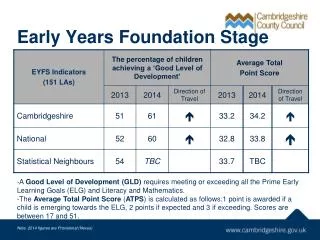
This report delves into the Early Years Foundation Stage (EYFS) profile data from July 2013, discussing the significance of learning figures such as point scores and developmental benchmarks. It highlights the average scores from a 2012 pilot program involving 20,000 children across 500 schools. Key findings indicate that approximately 50% are expected to achieve a Good Level of Development (GLD). The report also emphasizes trends among different demographics, such as gender, birth season, and language background, revealing vital insights into early educational development and transition readiness.

Understanding Early Years Foundation Stage Profiles: Key Insights and Data Analysis
E N D
Presentation Transcript
Early Years Foundation Stage Profile data 3 July 2013
What do the figures mean? • 1 point for emerging, 2 for expecting, 3 for exceeding • 17 areas reported numerically • Highest total points possible = 51 • Lowest = 17 • Mid point score = 34 • Pilot 2012, the average point score was 32 points
A Good Level of Development (GLD) • Redefined from previous years • Expected (i.e. 2 points) for each of the 12 areas in PSED, Communication and Language, Physical development, Literacy and Maths • Unofficially it is thought that approx. 50% will get a GLD this year
2012 pilot data20,000 children in 500 schools across 19 Local Authorities Who achieved a Good Level of Development? • 41% of all children • 48% of girls, 34% of boys • 52% of autumn born children, 30% of summer born • 30% of children with EAL compared to 43% of children whose first language is English • 45% of non-FSM and 24% of FSM children • 44% of Chinese children, 29% of Black children • Scores lowest in writing and number • Scores highest in both areas of Physical Development • 2.4% of children scored the lowest possible total point score of 17 • 1% of children scored the highest possible total point score of 51
Key messages • Reliability of this year’s data? • Cannot helpfully compare last year and this year’s GLD data • “Emerging” not a helpful term for year one teachers • Importance of transition - reception to year one • Importance of Prime areas • Importance of the Characteristics of Effective Learning • Literacy and Maths • Links between EYFSP and National Curriculum