Download
1 / 28
290 likes | 383 Vues
Long Island Sound has suffered from hypoxia for decades: Result of Global Warming? Eutrophication? It has always been like this…. EAST LIS. CENTRAL LIS. WEST LIS. NARROWS. Sampling mud. Design “proxies” for paleo- environmental research such as Salinity Temperature

E N D
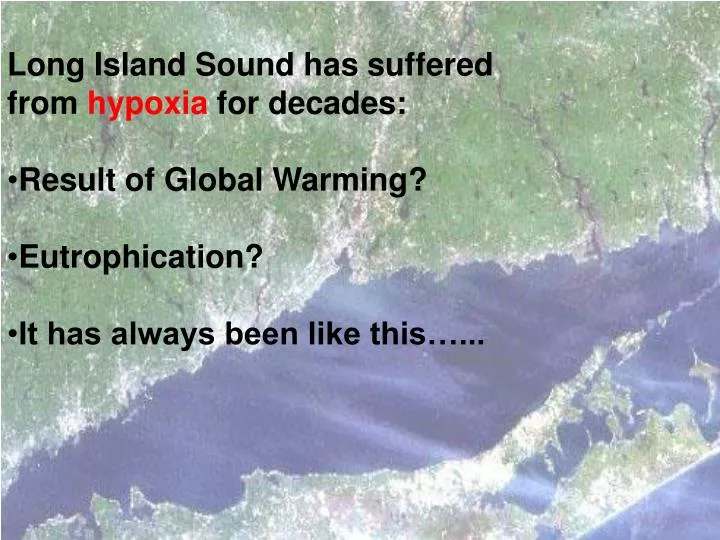
Long Island Sound has suffered • from hypoxia for decades: • Result of Global Warming? • Eutrophication? • It has always been like this…...
EAST LIS CENTRAL LIS WEST LIS NARROWS
Design “proxies” for paleo- environmental research such as • Salinity • Temperature • Faunal/floral characteristics • Oxygen saturation • Metals • Sewage • Calibrate proxies for these parameters on the modern LIS environment
137Cs Chestnut blight 210Pb Onset of hatting industry Ragweed pollen 14C
137CS HG 14C 14C
MEASURES OF ORGANIC PRODUCTIVITY: • BURIAL RATE OF ORGANIC CARBON • BURIAL RATE OF DIATOM “SKELETONS” • (BIOGENIC SILICA) • PRODUCTION RATE OF HETEROTROPHS LIKE FORAMINIFERA
The d13C values in foram “shells” are related to mixing of sea and river water (salinity) and to addition of “light carbon” from photosynthetic productivity
Estimate d13C variability not related to mixing of sea and river water (d13C*) • Measure d18O values in foraminiferal shells • Calculated18O of water using BWT • Estimate salinity from LIS mixing model • Estimated13C of dissolved inorganic carbonate using the LIS mixing model • Subtract calculated - observed values: d13C * =d13Ccarbonate -d13Ccalculated in water
% organic Carbon and d13C* CORE A1C1 Year AD
The d13C* value indicates the amount of oxidized Corg that was added to the bottom water column. The d13C* value serves as an indirect proxy for OCI or Oxygen Consumption Index (Level of Paleo Oxygenation)
CONCLUSIONS (1) • Major environmental changes in the early 1800’s: • Increased Corg and Bsi storage • Isotopically lighter carbon, lower O2 levels in bottom waters, sewage indicators, and metal pollutants • Increased productivity of benthic foraminifera
CONCLUSIONS (2) • Hypoxic events may have occurred since the early 1800’s but were absent before that time. They are severe in the late 20th century. Why? • Enhanced productivity==> more Corg • Modern global warming==> higher rate of Corg decompositon and increased water stratification HYPOXIANEED A COMBINATION OF HIGH BWT AND HIGH Corg LOADING