Download
1 / 20
200 likes | 308 Vues
Funding and Institutionalizing Emerging Forms of Transportation. Shana Retherford Johnson, AICP November 18, 2012 AASHTO Annual Meeting. Key Questions. Why are these emerging modes important? What is the role of the private sector? What is the role of the public sector?

E N D
Funding and Institutionalizing Emerging Forms of Transportation Shana Retherford Johnson, AICP November 18, 2012 AASHTO Annual Meeting
Key Questions • Why are these emerging modes important? • What is the role of the private sector? • What is the role of the public sector? • How are emerging forms of transportation funded now? • What might the potential impact be of additional funding for emerging forms of transportation
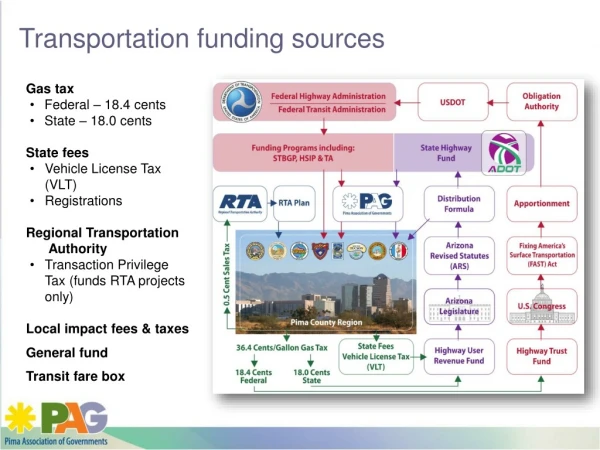
Work Trips by Mode -- 2009 Data/slide credit: Cynthia Burbank, AMPO Annual Conference, Sept. 12, 2012
Ridesharing, Bikesharing, and Transit Public Subsidies Arlington County, VA Capital Bikeshare Farebox Recovery (2011) 100% Cost Recovery 18%: ART (local bus) Ridesharing/Transit Data Credit: Cynthia Burbank, AMPO Annual Conference, Sept. 12, 2012 San Francisco MTC cost per passenger trip: $0.63 – Ridesharing Program $8.34 – Transit SFO, LA, DC, Denver, NY, Massachusetts total spending: $ 0.023 billion – Ridesharing programs $ 14.000 billion - Transit capital & options
Per-passenger GHG Emissions of Transportation Options Trip Reduction & Environmental Benefits Data Source: Hodges, Tina, Public Transportation’s Role in Responding to Climate Change, U.S. Department of Transportation, Federal Transit Administration, Jan. 2009 Information Source: Grant, Michael. “Vanpooling: Opportunities for Reducing GHG Emissions” Presentation to the ACT Vanpool Conference, April 2010. Capital Bikeshare members (18,000 – Nov 2011) reduce nearly 5 million driving miles per year Atlanta Clean Air Campaign 16 million car trips eliminated from metro Atlanta roadways and more than 200,000 tons of pollution not released into the air. Arlington County Commuter Services (Arlington, VA) reduces 40,100 vehicle trips on an average workday – while the theaverage lane of interstate highway carries approximately 4,000 – 6,000 vehicles in the rush period.
State of the Vanpool Industry • 68 vanpool programs report to NTD (2010) • Vanpool industry emerged in response to the 1970s energy crisis. • Many private sector firms started vanpool programs for their employees. • Public involvement in vanpools began mostly in the 1980s. • Why is the public sector involved in vanpooling? • Vanpool programs that report to National Transit Database earn additional Urbanized Area Formula Program (5307) for their regions (for large UZAs). • Fare “buy down” incentives for riders have led to dramatic vanpool program growth. • Provides transit in areas where traditional transit (i.e., commuter bus, commuter rail) are limited or absent. • Leverages investments in HOV facilities.
Directly Operated vs. Purchased Transportation Pierce Transit Vanpool, Seattle, WA • No Direct Rider Subsidy, Lower Fares vs. Direct Rider Subsidy and no Fare Control • Number of FTEs required to operate a program • Program functions • Level of involvement in day-to-day vanpool management • Required program funding
Funding and Use of 5307 • Directly Operated Programs • Operating Expenses: Fares cover 100% of operating costs in all programs interviewedfor the Northern Virginia Vanpools Incentive Program Study. • Capital Expenses: 5307, CMAQ (expansion), Job Access and Reverse Commute (JARC). • Administrative Expenses: 5307, CMAQ (marketing), some programs use farebox revenue. • Purchased Transportation Programs • Startup subsidy funding, marketing, and administration funding for purchased transportation programs (Houston, Los Angeles), including: CMAQ (marketing), JARC, 5307, local sales tax dedicated to transit (Houston, pre-1996). • 5307 Use: Programs can be supported entirely with the additional 5307 increment. • Houston uses 5307 increment earned to support rail expansion. • Los Angeles uses 5307 to provide the rider subsidies, among other non-vanpool related uses.
Dynamic Ridesharing • Dozens of Apps/Dynamic Ridesharing Firms (Zimride, Carticipate, RideAmgios, PickupPal) • Ridesharing Software firms incorporating dynamic capabilities. • Focused Pilot Programs (All Avego) • Go520 – Washington State DOT • WeGoMil – Northern Virginia Regional Commission • WeGoSonoma Avego – Dynamic Ridesharing App Passenger View
Bikesharing Systems Table Source: http://www.bicyclinginfo.org/promote/bikeshare.cfm?/bikeshare
Capital Bikeshare Trips If Capital Bikeshare had not been available, how would you most likely have made this trip? Capital Bikeshare Trip Characteristics (2011) • 1,364,435 total trips system-wide in 2011 • 1.4 million bicycle miles system wide • Average Trip Distance (Arlington Trips) -1.3 miles all users, 1.2 miles annual members, 1.8 miles casual members • Average trip length: Average trip was 22 minutes (4th Qtr. 2011). • If trips over 60 minutes are excluded, the average Capital Bikeshare trip is only 13 minutes long
Bikesharing Funding • Variety of funding for capital costs. Some innovative sources include: • Private foundations, public health grants, addition of bikeshare stations in the financial plans of larger transit and highway projects
Bikeshare State of Good Repair Arlington County Capital Bikeshare Plan – 2013-2018 CIP, 2019-2025 Capital Needs
Congestion Mitigation and Air Quality (CMAQ) CMAQ Funding by Project Type, 1992-2010 $30 billion invested since 1992 Information Source: FHWA, MAP-21 Webinar Series, Overview of MAP-21 provisions on the Congestion Mitigation and Air Quality Improvement (CMAQ) Program, September 13, 2012 http://www.fhwa.dot.gov/map21/docs/13sep_cmaq.pdf
CMAQ & MAP-21 Performance measures for traffic congestion and on-road mobile source emissions. States are required to establish targets for these measures within 1 year of the final rule on national performance measures. Each MPO with a transportation management area of more than one million in population representing a nonattainment or maintenance area is required to develop and update biennially a performance plan to achieve air quality and congestion reduction targets. USDOT and EPA will assess emission reductions, air quality and health impacts of actions funded under the CMAQ program since the enactment of SAFETEA-LU.
Common TDM Funding Sources Adapted from the Victoria Transport Policy Institute’s TDM Encyclopedia, Financing Options, Options For Funding Transportation Programs, available online at: http://www.vtpi.org/tdm/tdm119.htm.
Other TDM Funding Sources Transit Fare Commission Revenues Non-Transportation Grant Programs Private Foundations New Advertising, Sponsorship, and Partnership Opportunities
What is the role of State DOTs? • Help find new sources of funding! • Rationalize services and connect providers • Technical assistance and planning requirements (esp. mid-range plans) • Integrate TDM agencies into corridor-level TDM activities Most Common TDM Activates Reported of State DOTs Table Source: NCHRP Research Results Digest 348: State Department of Transportation Role in the Implementation of Transportation Demand Management
Thank you! Shana Retherford Johnson, AICP sjohnson@foursquareitp.com 301-774-4566 x402 Special thanks to Cynthia Burbank (PB) and Michael Grant (ICF) for their assistance with this presentation!