Download

1 / 24
240 likes | 256 Vues
This presentation explores the use of state and federal data sources for analyzing and modeling state health markets. Examples from Minnesota are provided, along with lessons learned and considerations for using both types of data.

E N D
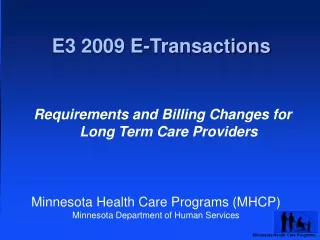
Using State and Federal Data to Analyze and Model State Health Markets: Examples and Lessons Learned Scott Leitz Director, Health Economics Program Minnesota Department of Health November 10, 2004
Overview • Some background on state and federal data sources for analysis and modeling • A few examples of Minnesota modeling exercises • Lessons learned and things to consider
State versus Federal data sources for analysis and modeling • State legislators generally believe their state is unique • Not having state data can be a reason not to do something, therefore collection of state-specific information is critical • But: not every question asked by state policymakers can be answered with state-specific data • Even when it can, the estimates can sometimes differ • Example: CPS versus state-specific surveys
State versus Federal data sources for analysis and modeling (II) • Even where state data may not be available, or is limited, national data can be used and adjustments made • Assumptions are important • National data is a good crosscheck to state data
Example 1 How much uncompensated care might result from a proposal to eliminate a state health insurance program for very low income people and reduce income eligibility for a Medicaid population?
The Challenge • Turning estimates of enrollment loss into hospital-specific estimates of uncompensated care • Multiple steps involved: • How many will end up without coverage? • How many services will this population seek? • How will that care get paid for? • How will behavior change? • Need for using both state and national data to answer these questions
A brief overview of methodology • Estimated number of people who would lose coverage under Governor’s proposal, adjusted for take-up (crowd out studies) • Adjust result to account for differences in expenditures between the uninsured and the insured: • Uninsured spend approximately half of what the insured spend on health care. (MEPS, Hadley & Holahan 2003, Long & Marquis 1994). • Adjustment to reflect that public program enrollees are sicker in general than the uninsured (2001 MN Health Access Survey, Holahan 2001). • Result: estimate uninsured spend 61% of what they would have spent if enrolled in a public program.
Methodology (II) • Resulting figure is the estimated use of services by the additional uninsured (“uninsured costs”). • Uninsured costs can be “paid” for in two ways: • Out of pocket payments by the uninsured • Uncompensated care • Research shows that the uninsured pay around a third of their health care costs • Surprisingly consistent across income levels • (MEPS, Hadley & Holahan 2003). • Remaining is uncompensated care
Methodology (III) • This uncompensated care figure is divided between hospital-based uncompensated care and clinic-based uncompensated care. • UC allocated 34% to clinics and 66% to hospitals (Hadley & Holahan 2003, 2000 Minnesota-specific analysis of uncompensated care).
Results: Estimated Impact on the Uninsurance Rate • Percentage of Minnesotans without health coverage increases by the following relative to current levels, assuming all other things remain constant: • Baseline, 2002: 5.4% • 2004: 6.0% • 2005: 6.4% • 2006: 6.5% • 2007: 6.6% • Additional of approximately 63,000 additonal uninsured Minnesotans
How Do These Estimated Increases in Uncompensated Care at Hospitals Compare to Current Levels? +88% +80% +63% +34%
Lessons learned • Using state-specific data is important, but it likely can’t answer every question • State-specific: UC baseline data, uninsured characteristics • Federal/national: MEPS, national studies • Can use both credibly, as long as their respective roles are appropriate • Use national data as crosscheck for state-specific data
Example 2 How will an aging population affect use of health care services and hospital bed capacity over the next 10, 20, and 30 years?
Very Brief Background on Example 2 • Minnesota has operated under a hospital inpatient bed construction moratorium since 1984 • Bed capacity essentially static for 20 years • Question: how will population demographics affect use of services and how will that compare to bed capacity?
Again: The need for both state and federal data • State: Demographic trends and projections, average length of stay • Federal: Hospitalization rates by age, average length of stay crosscheck
Projected Minnesota Population Growth,by Age Group Source: Minnesota State Demographic Center
In Sheer Numbers, How Much Will Minnesota’s Elderly Population Increase? Source: Miinnesota State Demographic Center
How Does Use of Health Care Services Vary by Age? Hospitals Hospitalization Rates by Age (2000 data) Baby boomers Sources: National Center for Health Statistics (2000 National Hospital Discharge Survey); U.S. Bureau of the Census
Projected Growth in Minnesota Hospital Utilization Source: Minnesota Department of Health, Health Economics Program
Sources of Growth in Projected Minnesota Hospital UtilizationExample: Inpatient Days Source: Minnesota Department of Health, Health Economics Program
Projections of Capacity Utilization (as % of total available MN hospital beds) Source: Minnesota Department of Health, Health Economics Program
Lessons learned • Questions are sometimes less complicated than they seem • Relatively simple projections can give you estimates that are likely as accurate as expensive, sophisticated modeling • Tradeoff: timeliness and cost versus perceived sophistication and credibility
Overall lessons learned and things to consider • Know what you can answer with state-specific data and what you can’t, and be prepared to support your decision • Know what to prepare for • CPS versus state-specific survey findings • How sophisticated does the analysis need to be? • Is it important it be an econometric model or does simple projection get you just as close? • Cost/Timeliness/model understanding critical
Overall lessons learned and things to consider • Contracting with experts versus doing your own modeling/projection • Credibility? • There’s nothing magic or mystical about modeling; understand assumptions and how the detail was arrived at • Use technical assistance • SHADAC, SCI, others • National data can be a critical and important crosscheck to state data