Download
1 / 8
80 likes | 108 Vues
Conduct break-even analysis to determine fixed and variable costs, indifference points, and optimal output ranges for new facility locations. Analyze example scenarios to select cost-effective location based on demand and capacity.

E N D
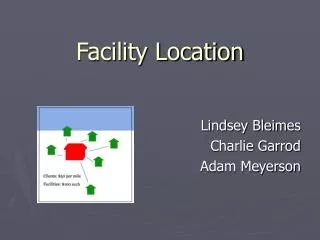
Facility LocationPart 3 byAnita Lee-Post
Break-even analysis • Determine the fixed and variable costs for each location. • Identify the indifference point for each pair of location alternatives. • Identify the ranges of output for which each location has the lowest total cost. • Select the location that gives the lowest cost for the design capacity of the new facility.
Break-even analysis example C&A Electronic is considering two possible sites for its new DVD plant. The annual fixed and variable costs for each site are: If annual demand for C&A’s DVD is expected to be 25,000 units, which is the best location?
Break-even analysis example continued • Determine the fixed and variable costs for each location Let Q be the demand of DVD, TC(Lexington) = 650000 + 50Q TC(Wilmore) = 350000 + 65Q
Break-even analysis example continued 2. Identify the indifference points between each pair of location alternatives Let Q* be indifference demand, TC(Lexington) = TC(Wilmire) at Q* 650000 + 50Q* = 350000 + 65Q* Q* = 300000/15 = 20,000 units
Break-even analysis example continued 3. Identify the ranges of output for which each location has the lowest total costs At Q = 0, TC(Lexington) = $650,000 TC(Wilmore) = $350,000 Q < 20,000, Wilmore has the lowest total cost; Q > 20,000 Lexington has the lowest total costs
Break-even analysis example continued 4. Select the location that gives the lowest cost for the design capacity of the new facility If Q = 25,000 Q > Q* (20,000) Lexington should be chosen as the location for the new facility