Data Analysis Practice Questions for Statistics Students
Test your statistics knowledge with these data analysis practice questions covering various topics such as correlation, scatter plots, histograms, and more.


Data Analysis Practice Questions for Statistics Students
E N D
Presentation Transcript
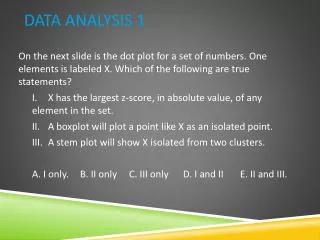
Data Analysis 1 On the next slide is the dot plot for a set of numbers. One elements is labeled X. Which of the following are true statements? I. X has the largest z-score, in absolute value, of any element in the set. II. A boxplot will plot a point like X as an isolated point. III. A stem plot will show X isolated from two clusters. A. I only. B. II only C. III only D. I and II E. II and III.
Data Analysis 2 Suppose the correlation is negative. Given two points from the scatterplot, which of the following is possible? I. The first point has a larger x-value and a smaller y-value than the second point. II. The first point has a larger x-value and a larger y-value than the second point III. The first point has a smaller x-value and a larger y-value than the second point. A. I only B. II only C. III only D. I and III E. I, II, and III
Data Analysis 3 To which of the boxplots can the histogram shown below correspond? (Choices on next slide)
Data Analysis 4 Consider the three points (4,33), (5,27), and (6,15). Given any straight line, we can calculate the sum of the squares of the three vertical distances from these points to the line. What is the smallest possible value this sum can be? A. 2.45 B. 6 C. 8.6 D. 36 E. none of these values.
Data Analysis 5 Which of the following are true statements? I. Stem plots are useful both for quantitative and categorical data sets. II. Stem plots are equally useful for small and very large data sets. III. Stem plots can show symmetry, gaps, clusters, and outliers. A. I only B. II only C. III only D. I and II E. I and III
Data Analysis 6 Which of the following scatter plots could have resulted in the residual plot shown below? (The y-axis scales are not the same in the scatterplots as in the residual plot.)
Data Analysis 7 A study is conducted relating AP Statistics exam scores to the total number of study hours for the AP Statistics class put in by students during the academic year, and the correlation is found to be 0.6. Which of the following are true statements? I. On the average, a 40 percent increase in study time results in a 24 percent increase in exam score. II. Sixty percent of a student’s exam score can be explained by the number of study hours. III. Higher exam scores tend to be associated with higher numbers of study hours. A. I and II B. I and III C. II and III D. I, II, and III E. None of the above gives the complete set of true responses.
Data Analysis 8 Given this back-to-back stem plot, which of the following are true? (Choices on the next slide.)
I. The Empirical Rule applies to both sets A and B. II. In one set the mean and median should be about the same, while in the other the mean appears to be less than the median. III. The ranges of the two sets are equal. A. I only B. II only C. III only D. I and II E. II and III
Data Analysis 9 If ten executives have salaries of $80,000, six have salaries of $75,000, and three have salaries of $ 70,000, what is the median salary? A. $75,000 B. $76, 842 C. $77,500 D. $80,000 E. None of the above.
Data Analysis 10 Which of the following are true statements about the correlation coefficient r ? I. A correlation of 0.3 means that 30% of the points are highly correlated. II. The square of the correlation measures the proportion of the y-variance that is predictable from a knowledge of x. III. Perfect correlation, that is, when the points lie exactly on a straight line, results in r = 0. A. I only B. II only C. III only D. None of these statements are true. E. None of the above gives the complete set of true responses.
Data Analysis 11 Given this cumulative plot, and using the most commonly accepted definition of outliers, what ages would be considered outliers? (Choices on next slide.)
A. Between 20 and 25 B. Between 20 and 30 C. Between 20 and 40 D. Between 20 and 25, or between 55 and 60 E. Between 20 and 30, or between 50 and 60
Data Analysis 12 Data on ages (in years) and prices (in $100) for ten cars of a specific model result in the regression line: Price = 250 – 30(Age). Given that 64% of the variation in price is explained by variation in age, what is the value of the correlation coefficient r ? A. -0.64 B. -0.80 C. 0.64 D. 0.80 E. There is insufficient information to answer this question.
Data Analysis 13 Given the two histograms below, which of the following statements are true? (See next slide.)
I. Both sets have the same mean. II. Both sets have the same range. III. Both sets have the same variance. A. I only B. I and II C. I and III D. I, II, and III E. None of the above gives the complete set of true responses.
Data Analysis 14 A real estate agent, working entirely on commission, weekly makes an average of $850 with a standard deviation of $260 selling property in the city and an average of $1,340 with a standard deviation of $390 selling property in suburbs. Assuming independence of what she sells in the two locations, what are the mean and standard deviation of her total weekly sales? • Mean = $1,095 and Standard Deviation = $325 • Mean= $1,095 and Standard Deviation = $469 • Mean = $2,190 and Standard Deviation = $325 • Mean = $2,190 and Standard Deviation = $469 • Mean = $2,190 and Standard Deviation = $650
Data Analysis 15 Given that the median is 270 and the interquartile range is 20, which of the following statements are true? I. 50% of the data are greater than or equal to 270. II. 50% of the data are between 260 and 280. III. 75% of the data are less than or equal to 280. A. I only B. II only C. III only D. I and II E. I, II, and III
Data Analysis 16 Consider the following three scatterplots:
Which of the following is a true statement about the correlation for the three scatterplots? A. None are 0. B. One is 0, one is negative, and one is positive. C. One is 0, and both of the others are negative. D. Two are 0, and the other is -1. E. Two are 0, and the other is close to -1.