Download
1 / 9
100 likes | 131 Vues
Explore the factors influencing food costs in the U.S. marketing system, from farm production to consumption. Learn about the value added at each stage and how it affects the final prices of various foods. Discover insights from government estimates and data on farm share of retail prices.

E N D
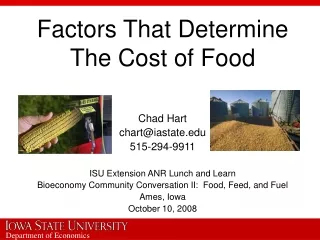
Factors That Determine The Cost of Food Chad Hart chart@iastate.edu 515-294-9911 ISU Extension ANR Lunch and Learn Bioeconomy Community Conversation II: Food, Feed, and Fuel Ames, Iowa October 10, 2008
U.S. Food Marketing System • Five distinct sectors • Agricultural production • 2 million farms • Food processing and manufacturing • 25,000 food and beverage companies • Wholesale distribution • 33,000 food wholesalers • Retail distribution • 113,000 food retailers • 378,000 foodservice companies • Consumption • 111 million households
U.S. Food Marketing System In 2001, government estimates showed: 23.7 million employed in the food system 12% of the nation’s gross domestic product Food is a major component of our economy Each step in the system adds value and costs
The Food Dollar Source: USDA-ERS
Declining Farm Value in Food In the 1950s, 25% of food was consumed away from home. Today, nearly 50% of food is consumed away from home. Source: USDA-ERS
Farm Value in Individual Foods Farm share of retail price1 Food 1998 1999 2000 (Percent) Milk, ½ gal. 41 39 34 Orange juice conc., 12 fl. oz. 38 37 33 Corn, 303 can (17 oz.) 23 22 22 Applesauce, 25-oz. jar 14 14 16 Tomatoes, whole, 303 can 7 7 7 Sugar, 1 lb. 32 31 27 Flour, wheat, 5 lbs. 20 18 19 Margarine, 1 lb. 26 17 15 Rice, long grain, 1 lb. 22 19 14 Peanut butter, 1 lb. 26 23 22 Potato chips, regular, 1-lb. bag 8 9 8 Chicken dinner, fried, frozen, 11 oz. 13 13 14 Potatoes, french fried, frozen, 1 lb. 11 11 10 Bread, 1 lb. 5 5 5 Corn flakes, 18-oz. box 4 4 4 1Computed from unrounded farm values. Source: USDA-ERS
Changes in Food Price Indexes 1BLS estimated expenditure shares, December 2007 2Forecasts updated July 21, 2008 Sources: Bureau of Labor Statistics, USDA-ERS
Quick Facts • Farm value is less than 20% of the food dollar. • Costs beyond the farm gate make up more than 80% of the food dollar. • Labor, transportation, energy, advertising, etc. • The farm value in the food dollar has dropped as people seek more food away from home and more processed foods.
Thanks for your time! Any questions?