Download
1 / 2
20 likes | 145 Vues
This is the American Confectionery Industry. About the National Confectioners Association

E N D
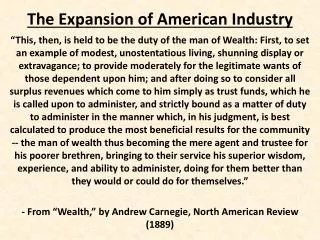
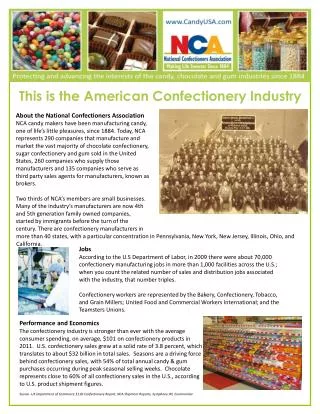
This is the American Confectionery Industry About the National Confectioners Association NCA candy makers have been manufacturing candy, one of life’s little pleasures, since 1884. Today, NCA represents 290 companies that manufacture and market the vast majority of chocolate confectionery, sugar confectionery and gum sold in the United States, 260 companies who supply those manufacturers and 135 companies who serve as third party sales agents for manufacturers, known as brokers. Two thirds of NCA’s members are small businesses. Many of the industry’s manufacturers are now 4th and 5th generation family owned companies, started by immigrants before the turn of the century. There are confectionery manufacturers in more than 40 states, with a particular concentration in Pennsylvania, New York, New Jersey, Illinois, Ohio, and California. Jobs According to the U.S Department of Labor, in 2009 there were about 70,000 confectionery manufacturing jobs in more than 1,000 facilities across the U.S.; when you count the related number of sales and distribution jobs associated with the industry, that number triples. Confectionery workers are represented by the Bakery, Confectionery, Tobacco, and Grain Millers; United Food and Commercial Workers International; and the Teamsters Unions. Performance and EconomicsThe confectionery industry is stronger than ever with the average consumer spending, on average, $101 on confectionery products in 2011. U.S. confectionery sales grew at a solid rate of 3.8 percent, which translates to about $32 billion in total sales. Seasons are a driving force behind confectionery sales, with 54% of total annual candy & gum purchases occurring during peak seasonal selling weeks. Chocolate represents close to 60% of all confectionery sales in the U.S., according to U.S. product shipment figures. Source -US Department of Commerce 311D Confectionery Report, NCA Shipment Reports, Symphony IRI, Euromonitor
Commodities Confectionery manufacturers spend more than $4 billion on commodities each year including: • More than 2.44 billion lbs of sugar at a cost of nearly $100 million • About 805 million lbs of cocoa beans costing more than $1 billion • More than 1.47 billion lbs of corn syrup at a cost of $245 million • More than 1.1 billion lbs of U.S. milk and milk products costing $762 million • More than 339 million lbs of peanuts, the majority of which are grown in the US, at a cost of more than $142 million • More than 74 million lbs of California-grown almonds and other nuts costing $101.5 million Commodity costs are rising across the board! Top 10 U.S. Candy Export Markets in 2011 Exports The NCA and confectionery industry are long time supporters of free trade. Most confections from other countries receive duty-free access into the U.S. and we seek trading parity to assist American businesses increase their export opportunities. Specifically, we support the Trans Pacific Partnership agreement that is under negotiation now. Free trade agreements represent opportunities for the U.S. confectionery industry to increase exports and thereby increase their consumption of US grown commodity inputs and add American jobs to the work force. World $1.6 billion Canada $674 million Mexico $213 million South Korea $80 million Japan $47 million Philippines $33 million Australia$31 million Panama$31 million Singapore $28 million United Arab Emirates $25 million Hong Kong $25 million Source: Global Trade Atlas National Confectioners Association1101 30th Street NW, Suite 200Washington, DC 20007 www.CandyUSA.com(202) 534-1440info@CandyUSA.com