Download
1 / 1
10 likes | 146 Vues
This study explores QSO/host interactions through advanced imaging and spectroscopy techniques. We analyze six nearby QSOs from the Hamburg ESO Survey, utilizing VLT/FORS1 for slit-spectroscopy and HST/ACS imaging. The MCS deconvolution method separates point sources from diffuse backgrounds, allowing for detailed spectral analysis. Results demonstrate that host galaxies exhibit signs of interaction, with ionized gas detected up to 8 kpc from the QSO. Our findings highlight the influence of QSOs on their environments, providing insights into the complex dynamics of these systems.

E N D
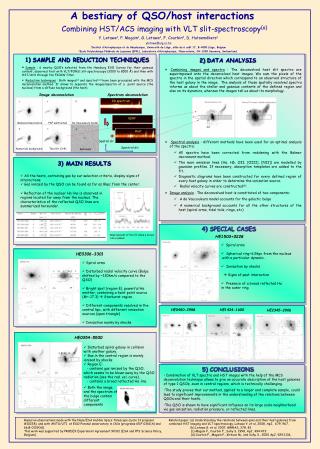
A bestiary of QSO/host interactions Combining HST/ACS imaging with VLT slit-spectroscopy(a) Y. Letawe1, P. Magain1, G. Letawe1, F. Courbin2, D. Hutsemékers1 yletawe@ulg.ac.be 1Institut d’Astrophysique et de Géophysique, Université de Liège, allée du 6 août 17, B-4000 Liège, Belgium 2Ecole Polytechnique Fédérale de Lausanne (EPFL), Laboratoire d’Astrophysique, Observatoire, CH-1290 Sauverny, Switzerland. • SAMPLE AND REDUCTION TECHNIQUES • DATA ANALYSIS • Sample : 6 nearby QSO’s selected from the Hamburg ESO Survey for their gaseous content, observed first with VLT/FORS1 slit-spectroscopy (3500 to 8500Å)and then with HST/ACS through the F606W filter. • Reduction techniques : Both images(c) and spectra(b,d) have been processed with the MCS deconvolution method. It allows to separate the images/spectra of a point source (the nucleus) from a diffuse background (the host). • Combining images and spectra : The deconvolved host slit spectra are superimposed onto the deconvolved host images. We sum the pixels of the spectra in the spatial direction which correspond to an observed structure of the host galaxy in the image. The analysis of those spatially resolved spectra informs us about the stellar and gaseous contents of the defined region and also on its dynamics, whereas the images tell us about its morphology. • Spectral analysis : different methods have been used for an optimal analysis of the spectra; • All spectra have been corrected from reddening with the Balmer decrement method. • The main emission lines (Hα, Hβ, OII, [OIII], [NII]) are modelled by gaussian profiles. If necessary, absorption templates are added to the fit. • Diagnostic diagrams have been constructed for every defined region of every host galaxy in order to determine the ionization source. • Radial velocity curves are constructed(b). • Image analysis : ;The deconvolved host is constituted of two components: • A de Vaucouleurs model accounts for the galactic bulge • A numerical background accounts for all the other structures of the host (spiral arms, tidal tails, rings, etc) - A Image deconvolution Spectrum deconvolution 2D spectrum QSO Reduced observation PSF subtracted De Vaucouleurs model Host + Spatial dir. Spectral dir. Numerical background Total fit (3+4) Residuals • 3) MAIN RESULTS • All the hosts, containing gas by our selection criteria, display signs of interactions; • Gas ionized by the QSO can be found as far as 8kpc from the center; • Reflection of the nuclear Hα line is observed in regions located far away from the nucleus. The characteristics of the reflected QSO lines are summarized hereunder. 4) SPECIAL CASES Improvement of the fit when a broad Hα is added HE1503+0228 • Spiral arms • Spherical ring~6.5kpc from the nucleus with a particular dynamic. • Ionization by shocks Signs of past interaction • Presence of a broad reflected Ha in the outer ring. HE0306-3301 • Spiral arms • Disturbed radial velocity curve (Bulge shifted by ~130km/s compared to the QSO) • Bright spot (region E), powerful Hα emitter, containing a faint point source (M~-17.3) Starburst region. • Different components resolved in the central kpc, with different ionization sources (open triangle) • Ionization mainly by shocks HE0450-2958 HE1434-1600 HE2345-2906 HE0354-5500 • Disturbed spiral galaxy in collision with another galaxy. • Gas in the central region is mainly ionised by shocks • Region E: • - contains gas ionized by the QSO, • which seems to be blown away by the QSO • radiation (see the rad. vel. curve). • - contains a broad reflected Hαline 5)CONCLUSIONS • Combination of VLT spectra and HST images with the help of the MCS deconvolution technique allows to give an accurate description of the host galaxies of type 1 QSOs, even in central regions, which is technically challenging. • The study proves that our method, applied to a larger and complete sample, could lead to significant improvements in the understanding of the relations between QSOs and their hosts. • The QSO is shown to have significant influence on its large scale neighborhood via gas ionization, radiation pressure, or reflected lines. • Both the image and the spectrum of the bulge contain different components Based on observations made with the Nasa/ESA Hubble Space Telescope (cycle 13 proposal #10238), and with ANTU/UT1 at ESO-Paranal observatory in Chile (programs 65.P-0361(A) and 66.B-0139(A)). This work was supported by PRODEX Experiment Agreement 90312 (ESA and PPS Science Policy, Belgium). • Related paper: (a) Understanding the relations between qsos and their host galaxies from combined HST imaging and VLT spectroscopy, Letawe Y. et al, 2008, ApJ, 679, 967. • (b) Letawe G. et al. 2007, MNRAS, 378, 83 • (c) Magain P., Courbin F., Sohy S. 1998, ApJ, 494:472 • (d) Courbin F., Magain P., Kirkove M., and Sohy S., 2000 ApJ, 529:1136,