Download
1 / 49
490 likes | 576 Vues
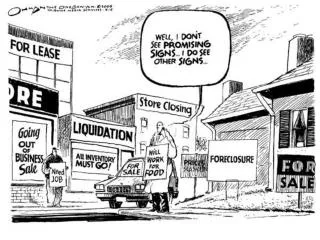
Explore the properties of the global economy's business cycles, identify indicators for forecasting, and analyze the impact of cycles on production, investment, and asset management decisions. Learn how to find good indicators and predict economic trends effectively.

E N D
Roadmap • News • Business cycles • What are they? • Terminology • What do they look like? • What makes a good indicator? • Forecasting • Using indicators
Why people care • How is business cycle analysis used? • Production, employment, investment, and pricing decisions • How would a boom affect each of these? • Does it depend on what you are producing? • Asset management decisions • Is a boom good or bad for equity? Bonds?
What is a business cycle? • Definitions • Short-term economic fluctuations (“high frequency”) • Arthur Burns and Wesley Mitchell: “Business cycles are a type of fluctuation found in the aggregate economic activity of nations.... A cycle consists of expansions occurring at about the same time in many economic activities, followed by similarly general recessions, contractions and revivals which merge into the expansion phases of the next cycle.” • The “official” cycle dates http://www.nber.org/cycles/recessions_faq.html • Business cycles are recurrent, but not periodic
Business cycle terminology peak trough 59 months 11 months
The Great Depression is still great Sources: BEA, BLS, Citi, FRB, and Geoffrey Moore.
Describing data • A variable is procyclical if it moves up and down with GDP, countercyclical if it moves in the opposite direction • A variable leads GDP if its ups and downs precede those in GDP, lags if its movements come after • We’ll develop a way to sort out leads and lags
Nondurables consumption Consumption GDP
Durables consumption Consumption GDP
Nonresidential investment GDP Investment
Nonfarm employment Employment GDP
Hours worked per worker Hours worked GDP
Yield spread Spread (right axis) GDP(left axis) spread = 10 year rate minus 2 year rate
Housing starts Starts (right axis) GDP(left axis)
Indentifying good indicators • How do you find good indicators? • Forecasting the future requires indicators that lead what you’re forecasting • Ask friends, read reports, look at ccf (next!) • Cross-correlation function (“ccf”) • Correlations between two variables at different times ccf(k) = corr(xt,yt-k) [plot this against k] • If k<0: x leads y [or y lags x] • If k>0: x lags y [or y leads x] • Easier to analyze than growth rate plots
Cross correlation graphs • Pictures: plot ccf(k) against k • y = IP growth • x = indicator • Does indicator lead or lag IP growth?
Contemporaneous correlation • Reminder: • ccf(k) = corr[x(t),y(t-k)] • For k = 0: • ccf(0) = corr[x(t),y(t)] • Use data marked • Red for x • Blue for y
Reminder: • ccf(k) = corr[x(t),y(t-k)] • For k = +1: • ccf(1) = corr[x(t),y(t-1)] • Means: x lags y • Use data marked • Red for x • Blue for y
Reminder: • ccf(k) = corr[x(t),y(t-k)] • For k = -1: • ccf(1) = corr[x(t),y(t+1)] • Means: y lags x • Use data marked • Red for x • Blue for y
Business cycle indicators • Leading indicators • Stock market returns • Consumer sentiment • Hours worked • Durable goods orders • Housing starts, building permits • New claims for unemployment insurance • Lagging indicators • Employment, unemployment rate
Summary • GDP growth is volatile • Information about fluctuations useful for • Production, employment, investment, and pricing • Asset management • Indicators differ in • Volatility • Cyclicality (pro or counter) • Lead and lag
What’s a good indicator? • Correlated with the variable of interest • Leads the variable • Timely: available quickly • Stable: not subject to significant revision that would make in-sample assessment unrealistic
What to forecast? • Forecast industrial production (IP) • A proxy for GDP • Available monthly, rather than quarterly • Covers mining, manufacturing, and utilities • More volatile than GDP
Industrial production Industrial Production GDP
What to forecast? • γt,t+k = k-period growth rate of IP • Monthly data at annual rate • This is a forward-lookinggrowth rate. It is different than our usual growth rate! !
Forecasting • Use historical patterns to predict future
What is IP growth 2010-2011? Nov 2007 Nov. 2009 Nov. 2008
What is IP growth 2010-2011? Nov 2007 Nov. 2009 Nov. 2008
Forecasting • Use historical patterns to predict future • 2010-2011 growth rate 1.85=(-0.87)*(-1)+0.98
How to forecast • Using a linear regression • is an indicator, is the residual • Sources of forecast error • Large residual variance (large standard error, low R2) • Uncertainty in estimates of (a,b) • Relation between γ and not stable • Data on γ and not stable • Relationship between γ and not linear
Forecasting • Example: xt = yield spread k = 24 months • Assessment • IP available monthly, revisions modest • Spread available immediately, never revised • R2 = 0.29: roughly 29% “explained”, 71% not • Standard error = 2.8% (+/– 2 std errors is huge!) • Data stability: IP revised somewhat, spread not • Bottom line: useful information
Flow chart • Compute forward-looking growth rate • Find indicator(s) xt • Estimate a relation using historical data • Output of regression is • Use current indicator xt and estimates to forecast future growth
Interpreting Regression Results • R2: Share of variance of dependent variable that is explained by regression. Adjusted R2 accounts for the use of multiple explanatory variables. • Standard error of coefficient: precision of estimate • t-statistic: ratio of coefficient to standard error (for a normal distribution, two standard deviations is significant at a 95% confidence interval) • Standard error of regression: can be used to establish a confidence interval around prediction. For example, plus/minus one standard deviation creates a 68% confidence interval around the forecast (assuming normality).
Questions • How much data should we use? • More is better • But relationships might change • Should we use multiple explanatory variables? • Yes • Lagged IP growth among them
Summary • Forecasting • Interest spread works well for GDP/IP growth • Still a lot of unpredictable uncertainty out there • Strategic issue: do you want to base plans on forecast, or build in “feedback” responses to inevitable surprises? • Where can I learn more? • Forecasting course: B90.2302, Deo and Hurvich