
Introduction
Low Back Pain and Physical Function Among Different Ethnicities. Adelle A Safo, Sarah Holder DO, Sandra Burge PhD The University of Texas Health Science Center at San Antonio. Introduction. Results.

Introduction
E N D
Presentation Transcript
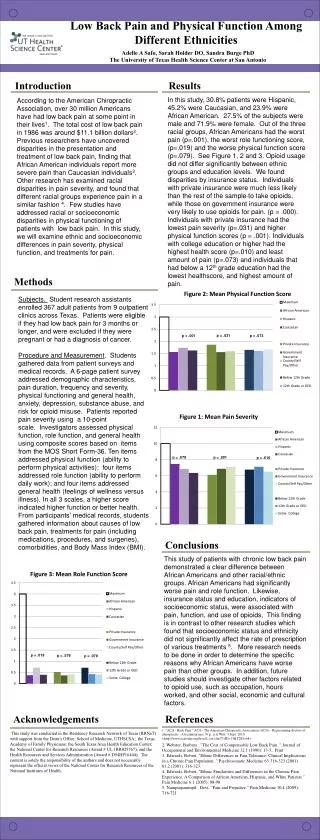
Low Back Pain and Physical Function Among Different Ethnicities Adelle A Safo, Sarah Holder DO, Sandra Burge PhD The University of Texas Health Science Center at San Antonio Introduction Results In this study, 30.8% patients were Hispanic, 45.2% were Caucasian, and 23.9% were African American. 27.5% of the subjects were male and 71.9% were female. Out of the three racial groups, African Americans had the worst pain (p=.001), the worst role functioning score, (p=.019) and the worse physical function score (p=.079). See Figure 1, 2 and 3. Opioid usage did not differ significantly between ethnic groups and education levels. We found disparities by insurance status. Individuals with private insurance were much less likely than the rest of the sampleto take opioids, while those on government insurance were very likely to use opioids for pain. (p = .000). Individuals with private insurance had the lowest pain severity (p=.031) and higher physical function scores (p = .001). Individuals with college education or higher had the highest health score (p=.010) and least amount of pain (p=.073) and individuals that had below a 12th grade education had the lowest healthscore, and highest amount of pain. According to the American Chiropractic Association, over 30 million Americans have had low back pain at some point in their lives1. The total cost of low back pain in 1986 was around $11.1 billion dollars2. Previous researchers have uncovered disparities in the presentation and treatment of low back pain, finding that African American individuals report more severe pain than Caucasian individuals3. Other research has examined racial disparities in pain severity, and found that different racial groups experience pain in a similar fashion 4. Few studies have addressed racial or socioeconomic disparities in physical functioning of patients with low back pain. In this study, we will examine ethnic and socioeconomic differences in pain severity, physical function, and treatments for pain. Methods Subjects. Student research assistants enrolled 367 adult patients from 9 outpatient clinics across Texas. Patients were eligible if they had low back pain for 3 months or longer, and were excluded if they were pregnant or had a diagnosis of cancer. Procedure and Measurement. Students gathered data from patient surveys and medical records. A 6-page patient survey addressed demographic characteristics, pain duration, frequency and severity, physical functioning and general health, anxiety, depression, substance abuse, and risk for opioid misuse. Patients reported pain severity using a 10-point scale. Investigators assessed physical function, role function, and general health using composite scores based on items from the MOS Short Form-36. Ten items addressed physical function (ability to perform physical activities); four items addressed role function (ability to perform daily work); and four items addressed general health (feelings of wellness versus illness). In all 3 scales, a higher score indicated higher function or better health. From participants’ medical records, students gathered information about causes of low back pain, treatments for pain (including medications, procedures, and surgeries), comorbidities, and Body Mass Index (BMI). p = .031 p = .073 p = .001 p = .079 p = .001 p = .610 Conclusions This study of patients with chronic low back pain demonstrated a clear difference between African Americans and other racial/ethnic groups. African Americans had significantly worse pain and role function. Likewise, insurance status and education, indicators of socioeconomic status, were associated with pain, function, and use of opioids, This finding is in contrast to other research studies which found that socioeconomic status and ethnicity did not significantly affect the rate of prescription of various treatments 5. More research needs to be done in order to determine the specific reasons why African Americans have worse pain than other groups. In addition, future studies should investigate other factors related to opioid use, such as occupation, hours worked, and other social, economic and cultural factors. p = .019 p = .579 p = .079 References Acknowledgements 1. "ACA - Back Pain." ACA - The American Chiropractic Association (ACA) - Representing doctors of chiropractic - A treatment met. N.p., n.d. Web. 3 Sept. 2010. <http://www.acatoday.org/level2_css.cfm?T1ID=13&T2ID=68>. 2. Webster, Barbara . "The Cost of Compensable Low Back Pain ." Journal of Occupational and Environmental Medicine 32.1 (1990): 13-5.. Print 3. Edwards, Robert. "Ethnic Differences in Pain Tolerance: Clinical Implications in a Chronic Pain Population ." Psychosomatic Medicine 63:316-323 (2001) 63.2 (2001): 316-323. 4. Edwards, Robert. "Ethnic Similarities and Differences in the Chronic Pain Experience: A Comparison of African American, Hispanic, and White Patients." Pain Medicine 6.1 (2005): 88-98 5. Nampiaparampil , Devi. "Pain and Prejudice." Pain Medicine 10.4 (2009): 716-721 This study was conducted in the Residency Research Network of Texas (RRNeT) with support from the Dean’s Office, School of Medicine, UTHSCSA; the Texas Academy of Family Physicians; the South Texas Area Health Education Center; the National Center for Research Resources (Award # UL 1RR025767); and the Health Resources and Services Administration (Award # D54HP16444). The content is solely the responsibility of the authors and does not necessarily represent the official views of the National Center for Research Resources of the National Institutes of Health.


