Download
1 / 46
460 likes | 578 Vues
This presentation explores the transformation in race classification within the federal statistical system following the multiracial movement of the 1990s. Spearheaded by advocacy groups and individuals affected by racial categorization, particularly those of mixed heritage, significant changes were made to allow self-identification with multiple races in Census 2000. This presentation evaluates the socio-political implications of these changes, how they reflect demographic shifts, and the ongoing dialogue regarding race in America. Key figures like Congressman Tom Sawyer and Ward Connerly are noted for their influence on policy decisions.

E N D
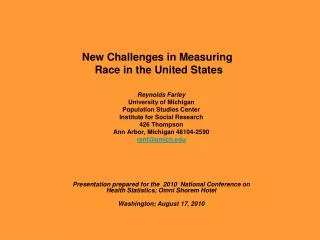
New Challenges in Measuring Race in the United States Reynolds Farley University of Michigan Population Studies Center Institute for Social Research 426 Thompson Ann Arbor, Michigan 48104-2590 renf@umich.edu Presentation prepared for the 2010 National Conference on Health Statistics; Omni Shorem Hotel Washington; August 17, 2010
The Multiracial Movement of the 1990s After Census 1990, a small social movement developed calling for a fundamental change in the way the federal statistical system classified people by race. Susan Graham played an important role in this. Rather than forcing persons to identify with one single race only, they insisted upon the addition of a “Multiple Races” category. Some leading advocates of this change were white women married to African-American men who found that their children were almost always classified as black by those who collected statistical data or tabulated persons by race. See: Kim M. Williams, Mark One or More Civil Rights in Multiracial America
The Government’s Response to the Multiracial Movement Congressman Tom Sawyer held congressional hearings in 1993 giving advocates a public platform for their arguments An increasing number of small but vocal advocacy groups called for the addition of multiracial as a race category including organizations of mixed race couples and campus groups of mixed race individuals. Speaker of the House Newt Gingrich recognized that control of Congress would depend upon how districts were drawn using Census 2000 data. He advocated adding a multiracial category to the census, perhaps because of a belief that this would make it more difficult to use racial data to draw districts likely to elect Democrats. Late in the decade, Ward Connerly joined the movement, perhaps because of a belief that large multiracial population might make the implementation of affirmative action more difficult.
Census Bureau Tests in the Mid-1990s Recognizing the strength of the multiracial movement, the Office of Management and the Budget in 1993 reopened the question of how the federal statistical system classifies persons by race. The Census Bureau conducted several tests of questionnaiares that included “Multiple race” as if it were a race. Other tests gave respondents the option of identifying with more than one race. Census Bureau tests suggested that no more than about 1.5 percent of the population would identify with “Multiple race” or select a second race if given the option to do so. Civil rights advocacy organization originally strongly opposed a change in the race question fearing a loss of numbers but Census Bureau findings led them to dampen their opposition to a change.
The Crucial Decisions of the Office of Management & Budget In 1997, OMB ruled: that, for purposes of federal statistics, there are five major races: White Black or African American or Negro American Indian or Alaskan Native Asian Native Hawaiian or Other Pacific Islander Census 2000 and subsequent federal statistical documents must allow individuals to identify with as many of the major races as they wish. Census 2000 received an exemption to include “Some Other Race” as a sixth major race. Other agencies were not exempt. Census 2000 and subsequent federal statistical documents must include a dichotomous question to identify the Spanish-origin population. Spanish-origin is an ethnic, not a racial, identification
Racial Composition of the United States; 1950 to 2007 Source: One percent microdata samples from public use files of the 1950 to 2000 censuses and the Public Use File from the 2007 American Community Survey.
The Changing Racial Composition of the United States The previous figure shows the changing racial composition of this country. Changes result from: Shifts in census procedures. In 1950, enumerators assigned race. By 1970 most households filled out their own census questionnaire. so respondents identified their own race. The racial categories have changed. Since 1980, many specific Asian and Pacific Islander groups have been specifically listed, thanks to the efforts of Congressman Matsui. The population of the US changed, especially after 1968 with the arrival of immigrants from Asia, Africa, the Middle East and Latin America. Introducing the option to identify with more than one race led to the identification of a substantial multiple race population – about one person in 40.
How Did Americans Use the Option to Identify with Multiple Races in Census 2000 • 2.6% Identified with Two or More Races • Among non-Hispanics, 2.0 % identified with Two or More • 97% of the “Some Other Race” population also identified themselves as Hispanic. • About one-quarter of the Multiple Race Population in Census 2000 were Hispanics who wrote a Spanish term for their second race.
Who Identifies with Multiple Races? • Age differences are great. In 2008, 5% of those under 10 were identified with two or more races; fewer than 1 % for those over age 64 did so. • Race differences are substantial. In 2008, 52 % of the Native Hawaiian and Other Pacific Islander population identified with a second race; 45 % of American Indians did so. For whites, it was only 3% • Educational Attainment differences in identifying with multiple races were small. • Geographic Differences in Identifying with Two or More Races are Large. In 2008, 21 % of the residents of Honolulu and 10 % in Anchorage identified with 2 or more races. In Birmingham, Alabama, Jackson, Mississippi, Portland, Maine and Sarasota, Florida; fewer than 1 % identified with 2 or more races.
A Census Bureau interview-reinterview survey in 2000 found that those who identify with multiple races are not consistent in their reporting of race. Only 40 % of those who identified with two or more races in the census, identified with two or more when asked the same question about 6 months later. About one-quarter of those who identified with American Indian only or with NHOPI only at the census date, identified with 2 or more races 6 months later. • The population identifying with more than one race did not generate controversy or litigation when redistricting was conducted after Census 2000.
Percent of Persons Classified by Age Identifying with Two or More of the OMB Major Races: American Community Survey, 2000 and 2008 Source: American Community Survey, Public Use Micro Data Files for 2000 and 2008.
The Reporting of Multiple Racesis Not Strongly Linked to Educational Attainment
Percent of Persons Ages 25 to 64, Classified by Educational Attainment,Identifying with Two or More of the OMB Major RacesAmerican Community Surveys, 2000 and 2008* *The major races defined by the OMB are American Indian, Asian, African American or Black, Native Hawaiian or Other Pacific Islander, Some Other Race, and White.
There are very large geographicdifferences in identifying withmultiple races
Less than 1.5% 1.5% to 2.3% 2.4% to 3.9% More than 4% Percent of the Total U.S. Population Identifying with Two or More Races
Change in How People Identify Themselves by Race and Spanish Origin; 2000 to 2008 • Modest increases in the percent identifying with two or more races • Increases are mainly due to more multiple-race youth. • A sharp rise in the Black and White populations, especially after 2006— a Barack Obama effect? • A large change from 2007 to 2008 in the racial identification of persons identifying themselves as Hispanics
Number of Races Reported: American Community Survey; 2000 to 2008 Source: American Community Survey; Public Use Microdata Samples; 2000 through 2008.
Percent of Persons Identifying with One Major Race Who Went On To Identify with a Second Major Race; American Community Survey: 2000 to 2008
Largest Multiple Race Populations in 2008 and Percent Change to 2008 Note: Multiple races that result from a respondent using a Spanish term for a second race are excluded
Asian or American Indian Only Hispanic Term Only Two or More Races White Only Black Only Reported Races of Persons Who Identified Themselves as Hispanics 2007 and 2008 American Community Surveys 2007 2008
Percent of Spanish Origin Population Using an Hispanic Term as Their Only Race
The Anticipated Growth of the Multiracial Population • Following Census 2000, most observers expected a growth of the multiracial population for several reasons: • Continued immigration leads to more racial diversity in the USA • Anecdotal and convincing demographic evidence indicated an increase in interracial marriages. • An growing percent of the nation’s children live in married couple families in which the mother and father differ by race. • There was an apparent increase in the number of prominent Americans who are multiracial including Tiger Woods, Derek Jeter, Halle Berry, and Barack Obama. • The multiracial movement appeared healthy and poised to grow.
Measuring Race Will Be Increasingly Challenging • A substantial increase in interracial marriages implies that the multiple race population is growing rapidly. • There is widespread consensus that race is a social construct. Perhaps, many people wish to construct their own racial identity. • Question order and question wording effects are very large.
Increasing Interracial MarriageImplies a Rapidly Growing Multiple RacePopulation
Trends in Interracial Marriage: 1950 to 2004 • The following three figures show trends in interracial marriage for non-Hispanic whites, blacks, American Indians and Asians. Data are shown for person who married shortly before the enumeration, e. g. under age 30 at time of the enumeration. • There is an unambiguous secular trend toward higher rates of interracial marriage for whites, blacks and American Indians. (see Lee & Edmonston, 2005) • Asian women are an exception. Because of the rapid growth of the Asian population, Asian women have an increasingly large pool of Asian men to marry. • Among both native born and immigrant Asian women, the current secular trend is toward more racially homogenous marriages. • Blacks and whites increasingly intermarriage, By the start of this millennium, about one black man in 7 who married had a white wife. Black women are also increasingly marrying white men.
Percent of Married-Spouse-Present Wives Under Age 30 Married to aHusband of a Different Race; 1950 to 2008 Note: For 2000 and after, data refer to wives who identified with only one race, such as white.
Percent of Married-Spouse-Present Husbands Under Age 30 Married to aWife of a Different Race; 1950 to 2008 Note: For 2000 and later, data refer to husbands who identified with only one race, such as white only.
Percent of White and Black Wives and Husbands Under Age 30 Married to a Spouse of the Other Race, 1950 to 2008
Percent of Children Under Age 18 in Married Couple Families withParents of Different Races
Percent of Households of Size Two or More that Include People Reporting Different Races
When Measuring Race, Ancestry orSpanish-Origin the Wording andPlacement of the QuestionInfluence the Results
Percent Change in Size of Ancestry Groups: Census 1990 to Census 2000 Note: These data refer to a respondent's first reported ancestry.
Census Quality Survey • To assess the consistency of reporting race, the Census Bureau conducted a Census Quality Survey immediately after Census 2000. • A sample of 55,000 dwelling units was selected with an over- representation of areas where multiple race reporting was frequent. • In the follow-up surveys, the Census Bureau attempted to interview the person who filled out the Census 2000 form. • Each respondent in this survey was interviewed twice between June and September, 2000. Once they filled out the Census 2000 form with its multiple races option and once the Census 1990 form that limited them to one racial identity. • Those who identified themselves in Census 2000 as white only, black only, or Asian only were highly consistent when asked the same race questions shortly after the census. • Those who identified with two or more races in Census 2000 were not consistent in reporting race. Only 40 percent of those who identified with two or more races in Census 2000 identified with two or more races when asked the identical question three to six months after the census date.
Consistency of Race Reporting for Non-Hispanics; Census 2000 and Census Quality Survey
The Need for Racial Statistics Persists*Efforts continue to minimize gaps in:*Morbidity and Mortality*Educational Attainment & Achievement Test Scores*And to end racial discrimination inthe labor and housing markets
Total Fertility Rates for Women 15 to 44 in 2008 from the National Center for Vital Statistics and from the American Community Survey
How Did Americans Use the Option to Identify with Multiple Races in Census 2000 • 2.6% Identified with Two or More Races • Among non-Hispanics, 2.0 % identified with Two or More • 97% of the “Some Other Race” population also identified themselves as Hispanic • About one-quarter of the Multiple Race Population in Census 2000 were Hispanics who wrote a Spanish term for their second race.
The American Community Survey and Racial Identification • The ACS now poses the Census 2000 long form questions to households every year. The public use sample now provides information annually for 1.3 million housing units. The sample size will steadily increase • Each year’s ACS sample is independently drawn. • Public Use Microdata Sample files from ACS now provide information about race, Spanish origin and ancestry for annual samples of 2.9 million. • The percent of persons identifying with more than one of the OMB six major races decreased from 2.1 percent in ACS 2000 to 1.9 percent in ACS 2005. The hypothesis that there has been no chance in the reporting of multiple races should be rejected. There has been a statistical significant decline in the percent identifying with two or more races
Changes in the Reported Race of Children inRacially Mixed Marriages • Interracial marriage couples differ in the race or races they report for their children depending upon their races. • Asian-white married couples were quite likely to use a multiple race identification for their children under age 18; 53 percent did so in 2000 and 52 percent in 2005. • There is considerable evidence that the “one drop rule” is rejected by many black-white married couples. In 2000, about 48 percent of “own” children in black-white married couples were listed as multiple by race; in 2005, about 43 percent. • White-American Indian and White-Some Other Race married couples most often reject the use of a multiple race identification for their children.
How Race was Reported for Children Under Age 18 in Mixed Race, Married-Couple Families. Source: U.S. Bureau of the Census, Public Use Microdata Samples from Census 2000 and the American Community Survey, 2007.
Less than 1.5% 1.5% to 2.3% 2.4% to 3.9% More than 4% Percent of the U.S. Population Under Age 15 Identifying with Two or More Races
Less than 1.5% 1.5% to 2.3% 2.4% to 3.9% More than 4% Percent of the U.S. Population Over Age 30 Identifying with Two or More Races