Download
1 / 1
10 likes | 144 Vues
Single -Particle and SDW Charge Dynamics In and : A Comparative Overview. T.Vuletić 1 , D.Herman 1 , N.Biškup 1 , M.Pinterić 1,2 , A.Omerzu 1 , S.Tomić 1 , M.Nagasawa 3 contact e-mail: tvuletic@ifs.hr, vuletic@lps.u-psud.fr; stomic@ifs.hr

E N D
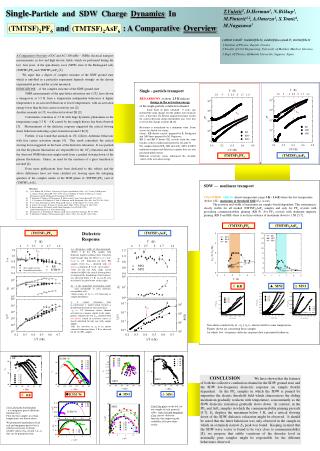
Single-Particle and SDW Charge Dynamics In and: A Comparative Overview T.Vuletić1, D.Herman1, N.Biškup1, M.Pinterić1,2, A.Omerzu1, S.Tomić1, M.Nagasawa3 contact e-mail: tvuletic@ifs.hr, vuletic@lps.u-psud.fr; stomic@ifs.hr 1 Institute of Physics, Zagreb, Croatia 2 Faculty of Civil Engineering, University of Maribor, Maribor, Slovenia 3 Dept. Of Physics, Hokkaido University, Sapporo, Japan (TMTSF)2PF6 (TMTSF)2AsF6 A Comparative Overview of DC and AC (100 mHz – 1MHz) electrical transport measurements, in low and high electric fields, which we performed during the last four years, of the spin-density wave (SDW) state of the Bechagaard salts (TMTSF)2PF6 and (TMTSF)2AsF6 [1]. We argue that a degree of complex structure of the SDW ground state which is unfolded in a particular experiment depends strongly on the chosen experimental probe and the crystal measured. INDICATIONS of the complex structure of the SDW ground state NMR measurements of the spin-lattice relaxation rate (1/T1) have shown a changeover at 3.5 K from a temperature independent behaviour at higher temperatures to an activated behaviour at lower temperatures, with an activation energy lower than the free carrier resistivity one [2]. Another anomaly in 1/T1 was detected at about 2K [2]. Calorimetric transition at 3.5 K with large hysteretic phenomena in the temperature range 2.5 K – 4 K caused by the sample history has been observed [3]. Measurements of the dielectric response suggested the critical slowing down behaviour indicating a glass transition around 2 K [3]. Further, it was found that anomaly in 1/T1 follows Arrhenius behaviour with free carrier activation energy [4]. This result contradicts the critical slowing down suggested on the basis of the dielectric relaxation. It was pointed out that the phason fluctuations are responsible for the 1/T1 relaxation and that the observed NMR behaviour might result from a gradual slowing down of the phason fluctuations. Hence, no need for the existence of a glass transition is invoked [4]. Even more publications have been dedicated to this subject and the above differences have not been clarified yet, leaving open the intriguing question of the complex nature of the SDW phase of (TMTSF)2PF6 (and of (TMTSF)2AsF6). Single - particle transport RED ARROWS at about 2.5 K indicate change in the activation energy of the single-particle conduction channel. Same kind of plots obtained 9 years ago featured the same change, but the authors were unaware of it, at that time [5]. Recent magnetoresistance results for current direction along intermediate axis were first to reveal this change at about 4K [6]. Resistance is normalized on a minimum value. Some curves are shifted for clarity. Letters KB denote crystals prepared by K. Bechgaard and MN those prepared by M. Nagasawa. KB S and KB P denote PF6 crystals from the same batches as those studied and reported in [3] and [5]. For samples denoted PF6, KB and AsF6, MN1 & MN2 nonlinear transport and dielectric response data are also presented further below. Different resistivity ratios influenced the absolute values of the activation energy. (TMTSF)2AsF6 (TMTSF)2PF6 SDW — nonlinear transport COLOUREDAREAS denote temperature range 3 K - 1.6 K where the low temperature (below 4 K) maximum of threshold field(ET) occurs. The position and width of maximum are sample (batch)dependent. This maximum is clearly visible for all studied (TMTSF)2AsF6 samples and only for PF6 crystals with prevailing commensurability pinning (KB P). For PF6 crystals with dominant impurity pinning (KB S and KB) there is no firm evidence of maximum down to 1.5K [5,7]. • References • [1] (a) N. Biškup, Ph. D. Thesis, University of Zagreb, unpublished (1996); (b) S. Tomić, N.Biškup and • A. Omerzu, Synth. Metals 85, 1597 (1997) and (c) N. Biškup, T. Vuletić, D. Herman, S. Tomić, • M. Nagasawa and K. Bechgaard, Proceedings of ICSM'98. • [2] T. Takahashi, Y. Maniwa, H. Kawamura, K. Murata and G. Saito, Synth. Metals 19, 225 (1987). • [3] J. C. Lasjaunias, K. Biljaković, F. Nad', P. Monceau and K. Bechgaard, Phys. Rev. Lett.72, 1283 (1994). • [4] W. G. Clark, M. E. Hanson, W. H. Wong and B. Alavi, J. de Physique IV, C2, 3, 235 (1993). • [5] S. Tomić, J. R. Cooper, W. Kang, D. Jerome and K. Maki, J. Phys. I France 1. 1603 (1991). • [6] B. Korin-Hamzić, M. Basletić and K. Maki, Europhys. Lett. 43, 450 (1998) • and B. Korin-Hamzić et al., These Proceedings. • [7] M. Nagasawa, T. Sambongi, K. Nomura and H. Anzai, Solid State Commun. 93, 33 (1995). • [8] T. Takahashi, Y. Maniwa, H. Kawamura and G. Saito, J. Phys. Soc. Jpn. 55, 1364 (1986). (TMTSF)2PF6 (TMTSF)2AsF6 (TMTSF)2AsF6 (TMTSF)2PF6 • Dielectric Response • 1-a determines width of relaxation mode • Below 5 K, five PF6 samples with dominant impurity pinning show relaxation mode broader than the Debye (1-a = 0.8). (1-a) vs. 1/T behaviour for these PF6 samples exerts TCO , (denoted with red arrow), as found in R vs.1/T curves above. • Only for the one AsF6 single crystal (denoted as MN1) the critical slowing down, accompanied by broadening of the response, was observed below 1.7 K. (as can be seen on related ε"(ω) plot below on the right). • Δε is the magnitude of relaxation mode • (and corresponds to static dielectric susceptibility ε(0)) • Main feature of Δε vs. 1/T behaviour is sample dependency. • τ0 is central relaxation time in Littlewood ’s model which features a distribution function for relaxation times. • τ0 vs. 1/T behaviour shows thermal activation in a manner similar to the single-particle conductivity, but TCO, (denoted with red arrow), found in resistivity curves is clearly identified for only one AsF6 sample (MN2). • Still, the crossover in τ0 to an almost saturated behaviour below 2 K is observed for the two PF6 samples. ◊ KB ▲ MN2 ∆ MN1 Non-ohmic conductivity (σ - σ0 )/ σ0 vs. electric field for some temperatures. Figures shown are concerning those samples for which low - frequency dielectric response data is presented further on. CONCLUSION We have shown that the features of both the collective conduction channel in the SDW ground state and the SDW low-frequency dielectric response are sample (batch) dependent. In the PF6 samples in which the SDW is pinned by impurities the electric threshold field which characterizes the sliding mechanism gradually weakens with temperature, concomitantly as the SDW dielectric relaxation gradually slows down. In contrast, in the PF6 and AsF6 samples in which the commensurability pinning prevails [5,7], ET displays the maximum below 3 K, and a critical slowing down of the SDW dielectric relaxation might be observed. It should be noted that the latter behaviour was only observed in the sample in which an extremely narrow ET peak was found. Keeping in mind that the SDW wave vector is found to be very close to commensurability [8], we propose that subtle variations of the disorder level in nominally pure samples might be responsible for the different behaviours observed. ▲ MN2 ∆ MN1 ICSM ’96 ◊ KB Cole-Cole plots (on the left, for one sample of each material) relate real ε’(ω) and imaginary ε"(ω) part of dielectric function, thus improving the credibility of fit procedure results. ε"(ω), dielectric loss function - it is imaginary part of dielectric function ε(ω); Plots for four samples at certain temperatures are shown above. We performed simultaneous fit of real and imaginary parts of ε(ω), which is necessary to obtain reliable values of τ0, Δε and 1-a, as they are fit parameters here.