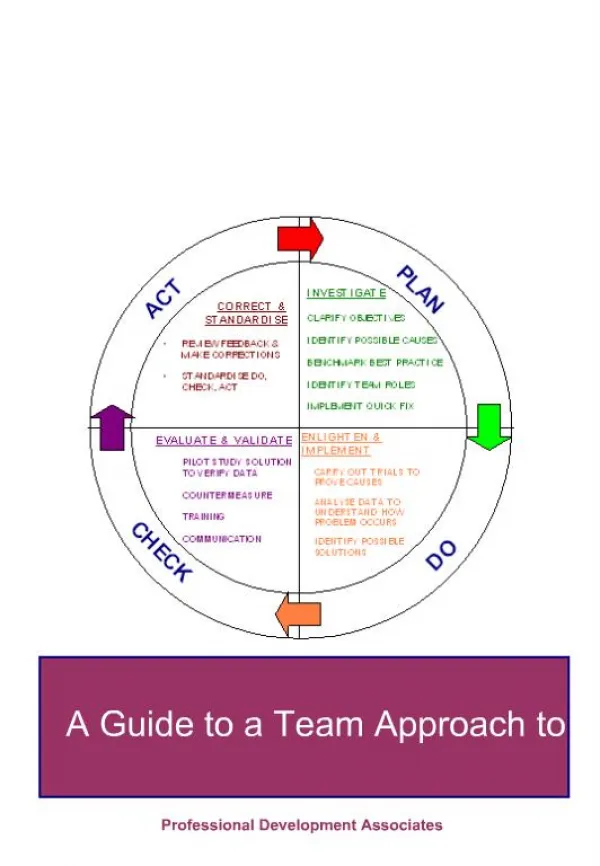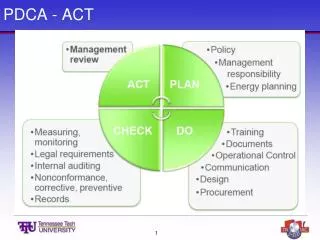
PDCA CYCLE
PDCA CYCLE. 7 Basic Tools. Flow Chart Check Sheet Histogram Pareto Chart Scatter Diagram Cause & Effect Diagram Run Chart/Statistical Process Control. Flow Charts are used to. document a process improve understanding reveal differences in methods uncover non-value added activities.

PDCA CYCLE
E N D
Presentation Transcript
7 Basic Tools Flow Chart Check Sheet Histogram Pareto Chart Scatter Diagram Cause & Effect Diagram Run Chart/Statistical Process Control
Flow Charts are used to... • document a process • improve understanding • reveal differences in methods • uncover non-value added activities
Flow Chart Example: Self-Serve Gas Before Improvement shut off engine walk to pay station Drive in self serve? check price to pump yes no turn on pump back to car pump gas walk to booth wait transmit approved? check card yes no copy to file return to car employee totals charges check accuracy prepare receipt sign copy on the road again copy to wallet
Flow Chart Example: Self-Serve Gas After Improvement shut off engine check price go to pump self-serve? Drive in insert card in pump yes no wait for receipt store in system approved? yes on the road again pump gas check credit card wait no copy to wallet
CHECK SHEETS Data collection & analysis • Contents mixed • Poor taste • Low temperature • Utensils dirty • Price issue • Other
Uniform Bell-Shaped Bimodal Histograms Graphical descriptive statistics (mean and standard deviation)
Pareto Charts • Similar to a histogram, used to find “most popular” category • Based upon the Pareto principle...
Basic Pareto Diagram Complaints courtesy of my Spring OPC class
Alternate Pareto Diagram Complaints courtesy of my Spring OPC class
Class 1 Class 2 Scatter Diagram Graphical descriptive statistics (correlation) Exam Score Homework Problems
Cause & Effect Diagrams • Also known as fishbone diagrams or Ishikawa diagrams, after their creator Kaoru Ishikawa • In general, used to find and cure causes (NOT symptoms) of problems
Cause & Effect Example METHODS MANPOWER Drivers lost Poor dispatching Chef late Large order snafus LATE PIZZA DELIVERY FRIDAY & SATURDAY Bad cars Small ovens Lack of ingredients MACHINES MATERIALS
Run Chart • Graphical descriptive statistics (trend)
Statistical Process Control • Finds “special” variation • General form of limits • Center line = Average * Not the variance