Download
1 / 94
940 likes | 1.07k Vues
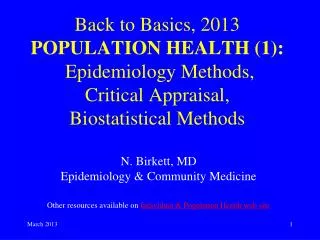
Back to Basics, 2013 POPULATION HEALTH (1): Epidemiology Methods, Critical Appraisal, Biostatistical Methods. N. Birkett, MD Epidemiology & Community Medicine Other resources available on Individual & Population Health web site. THE PLAN (1). Session 1 (March 18, 1300-1700 )

E N D
Back to Basics, 2013POPULATION HEALTH (1): Epidemiology Methods, Critical Appraisal,Biostatistical Methods N. Birkett, MD Epidemiology & Community Medicine Other resources available on Individual & Population Health web site
THE PLAN (1) • Session 1 (March 18, 1300-1700) • Diagnostic tests • Sensitivity, specificity, validity, PPV • Critical Appraisal • Intro to Biostatistics • Brief overview of epidemiological research methods
THE PLAN (2) • Aim to spend about 2.5-3 hours on lectures • Review MCQs in remaining time • A 10 minute break about half-way through • You can interrupt for questions, etc. if things aren’t clear. • Goal is to help you, not to cover a fixed curriculum.
INVESTIGATIONS (1) • 78.2 • Determine the reliability and predictive value of common investigations • Applicable to both screening and diagnostic tests.
Reliability • = reproducibility. Does it produce the same result every time? • Related to chance error • Averages out in the long run, but in patient care you hope to do a test only once; therefore, you need a reliable test
Validity • Whether it measures what it purports to measure in long run • is a disease present (or absent) • Normally use criterion validity, comparing test results to a gold standard • Link to SIM web on validity
Reliability and Validity: the metaphor of target shooting.Here, reliability is represented by consistency, and validity by aim Reliability LowHigh • • • • • • • • Low Validity • • • • • • • • High • • • • • • • •
Test Properties (1) True positives False positives False negatives True negatives
Test Properties (2) Sensitivity = 0.90 Specificity = 0.95
2x2 Table for Testing a Test Gold standard Disease Disease Present Absent Test Positive a (TP) b (FP) Test Negative c (FN) d (TN) Sensitivity Specificity = a/(a+c) = d/(b+d)
Test Properties (6) • Sensitivity = Pr(test positive in a person with disease) • Specificity = Pr(test negative in a person without disease) • Range: 0 to 1 • > 0.9: Excellent • 0.8-0.9: Not bad • 0.7-0.8: So-so • < 0.7: Poor
Test Properties (7) • Sensitivity and Specificity • Values depend on cutoff point between normal/abnormal • Generally, high sensitivity is associated with low specificity and vice-versa. • Not affected by prevalence, if ‘case-mix’ is constant • Do you want a test to have high sensitivity or high specificity? • Depends on cost of ‘false positive’ and ‘false negative’ cases • PKU – one false negative is a disaster • Ottawa Ankle Rules: insisted on sensitivity of 1.00
Test Properties (8) • Sens/Spec not directly useful to clinician, who knows only the test result • Patients don’t ask: • “If I’ve got the disease, how likely is a positive test?” • They ask: • “My test is positive. Does that mean I have the disease?” • → Predictive values.
Predictive Values • Based on rows, not columns • PPV = a/(a+b); interprets positive test • NPV = d/(c+d); interprets negative test • Depend upon prevalence of disease, so must be determined for each clinical setting • Immediately useful to clinician: they provide the probability that the patient has the disease
Test Properties (9) PPV = 0.95 NPV = 0.90
2x2 Table for Testing a Test Gold standard Disease Disease Present Absent Test + a (TP) b (FP) PPV = a/(a+b) Test - c (FN) d (TN) NPV= d/(c+d) a+c b+d N
Prevalence of Disease • Is your best guess about the probability that the patient has the disease, before you do the test • Also known as Pretest Probability of Disease • (a+c)/N in 2x2 table • Is closely related to Pre-test odds of disease: (a+c)/(b+d)
Test Properties (10) Prevalence proportion Prevalence odds
Prevalence and Predictive Values • Predictive values of a test are dependent on the pre-test prevalence of the disease • Tertiary hospitals see more pathology then FP’s • Their positive tests are more often true positives. • How do you determine how useful a test is in a different patient setting?
Prevalence and Predictive Values • Often called ‘calibrating’a test for use • Relies on the stability of sensitivity & specificity across populations. • Allows us to estimate what the PPV and NPOV would be in a new population.
Methods for Calibrating a Test Four methods can be used: • Apply definitive test to a consecutive series of patients • rarely feasible, especially during the LMCCs • Hypothetical table • Assume the new population has 10,000 people • Fill in the cells based on the prevalence, sensitivity and specificity • Bayes’s Theorem (Likelihood Ratio) • Nomogram • only useful if you have access to the nomogram • You need to be able to do one of the last 3. • By far the easiest is using a hypothetical table.
Calibration by hypothetical table Fill cells in following order: “Truth” Disease Disease Total PV Present Absent Test Pos 4th 7th 8th 10th Test Neg 5th 6th 9th 11th Total 2nd 3rd10,000 (1st)
Test Properties (11) Tertiary care: research study. Prev=0.5 PPV = 0.89 Sens = 0.90 Spec = 0.95
Test Properties (12) Primary care: Prev=0.01 585 90 495 PPV = 0.1538 10 9,405 9,415 100 9,900 Sens = 0.90 Spec = 0.95
Calibration by Bayes’ Theorem • You don’t need to learn Bayes’ theorem • Instead, work with the Likelihood Ratio (+ve) • Equivalent process exists for Likelihood Ratio (–ve), but we shall not calculate it here • Consider the following table (from a research study) • How do the ‘odds’ of having the disease change once you get a positive test result?
Test Properties (13) Post-test odds (+ve) = 18.0 Pre-test odds = 1.00 Odds (after +ve test) are 18-times higher than the odds before you had the test. This is the LIKELIHOOD RATIO.
Calibration by Bayes’s Theorem • LR(+) is fixed across populations just like sensitivity & specificity. • Bigger is better. • Likelihood ratios are related to sens & spec LR(+) = sens/(1-spec) • Sometime given as the definition or the LR(+) • obscures what is really going on
Calibration by Bayes’s Theorem • How does this help? • Remember: • Post-test odds(+) = pretest odds * LR(+) • And, the LR(+) is ‘fixed’ across populations • To ‘calibrate’ your test for a new population: • Use the LR(+) value from the reference source • Estimate the pre-test odds for your population • Compute the post-test odds • Convert to post-test probability to get PPV
Converting between odds & probabilities • if prevalence = 0.20, then • pre-test odds = .20/0.80 = 0.25 • if post-test odds = 0.25, then • PPV = .25/1.25 = 0.20
Example of Bayes' Theorem(‘new’ prevalence 1%, sens 90%, spec 95%) • Compare to the ‘hypothetical table’ method (PPV=15.38%)
Calibration with Nomogram • Graphical approach which avoids arithmetic • Scaled to work directly with probabilities • no need to convert to odds • Draw line from pretest probability (=prevalence) through likelihood ratio • extend to estimate posttest probabilities • Only useful if someone gives you the nomogram!
Example of Nomogram(pretest probability 1%, LR+ 18, LR– 0.105) 15% 18 1% .105 0.01% LR Pretest Prob. Posttest Prob. April 2011 32
Are sens & spec really constant? • Generally, assumed to be constant. BUT….. • Sensitivity and specificity usually vary with case mix (severity of disease) • May vary with age and sex • Therefore, you can use sensitivity and specificity only if they were determined on patients similar to your own • Risk of spectrum bias (populations may come from different points along the spectrum of disease)
Cautionary Tale #1: Data Sources The Government is extremely fond of amassing great quantities of statistics. These are raised to the nth degree, the cube roots are extracted, and the results are arranged into elaborate and impressive displays. What must be kept ever in mind, however, is that in every case, the figures are first put down by a village watchman, and he puts down anything he damn well pleases! Sir Josiah Stamp, Her Majesty’s Collector of Internal Revenue.
78.2: CRITICAL APPRAISAL (1) • “Evaluate scientific literature in order to critically assess the benefits and risks of current and proposed methods of investigation, treatment and prevention of illness” • UTMCCQE does not present hierarchy of evidence (e.g., as used by Task Force on Preventive Health Services)
Hierarchy of evidence(lowest to highest quality, approximately) • Systematic reviews • Experimental (Randomized) • Quasi-experimental • Prospective Cohort • Historical Cohort • Case-Control • Cross-sectional • Ecological (for individual-level exposures) • Case report/series • Expert opinion } similar/identical
Cautionary Tale #2: Analysis Consider a precise number: the normal body temperature of 98.6°F. Recent investigations involving millions of measurements have shown that this number is wrong: normal body temperature is actually 98.2°F. The fault lies not with the original measurements - they were averaged and sensibly rounded to the nearest degree: 37°C. When this was converted to Fahrenheit, however, the rounding was forgotten and 98.6 was taken as accurate to the nearest tenth of a degree.
BIOSTATISTICS Core concepts (1) • Sample: • A group of people, animals, etc. which is used to represent a larger ‘target’ population. • Best is a random sample • Most common is a convenience sample. • Subject to strong risk of bias. • Sample size: • the number of units in the sample • Much of statistics concerns how samples relate to the population or to each other.
BIOSTATISTICS Core concepts (2) • Mean: • average value. Measures the ‘centre’ of the data. Will be roughly in the middle. • Median: • The middle value: 50% above and 50% below. Used when data is skewed. • Variance: • A measure of how spread out the data are. • Defined by subtracting the mean from each observation, squaring, adding them all up and dividing by the number of observations.
BIOSTATISTICS Core concepts (2) • Standard deviation: • square root of the variance.
BIOSTATISTICS Core concepts (3) • Standard error (of the mean): • Standard deviation looks at the variation of the data in individuals • We usually study samples. • Select 10 people • measure BMI • take the group average • Repeat many times. • Each time, we get a mean of the sample • What is the distribution of these means? • Will be ‘normal’, ‘Gaussian’ or ‘Bell curve’ • Mean of the means • same as population mean • Variance of the means is • smaller.
BIOSTATISTICS Core concepts (4) • Standard error (of the mean): • Confidence Interval: • A range of numbers which tells us where we believe the correct answer lies. • For a 95% confidence interval, we are 95% sure that the true value lies inside the interval. • Usually computed as: mean ± 2 SE
Example of Confidence Interval • If sample mean is 80, standard deviation is 20, and sample size is 25 then: • We can be 95% confident that the true mean lies within the range: 80 ± (2*4) = (72, 88).
Example of Confidence Interval • If the sample size were 100, then • 95% confidence interval is 80 ± (2*2) = (76, 84). • More precise.
Core concepts (4) • Random Variation (chance): • every time we measure anything, errors will occur. • Any sample will include people with values different from the mean, just by chance. • These are random factors which affect the precision (SD) of our data but not the validity. • Statistics and bigger sample sizes can help here.
Core concepts (5) • Bias: • A systematic factor which causes two groups to differ. • A study uses a two section measuring scale for height which was incorrectly assembled (with a 1” gap between the upper and lower section). • Over-estimates height by 1” (a bias). • Bigger numbers and statistics don’t help much; you need good design instead.
BIOSTATISTICSInferential Statistics • Draws inferences about populations, based on samples from those populations. • Inferences are valid only if samples are representative (to avoid bias). • Polls, surveys, etc. use inferential statistics to infer what the population thinks based on talking to a few people. • RCTs use them to infer treatment effects, etc. • 95% confidence intervals are a very common way to present these results.
An experiment (1) • Here is a ‘fair’ coin • I will toss it to generate some data (heads or tails) • Write the sequence on the board
An experiment (2) • At some point, you get suspicious • the number of ‘heads’ in a row exceeds what is reasonable. • This is the core of hypothesis testing