Download
1 / 32
340 likes | 571 Vues
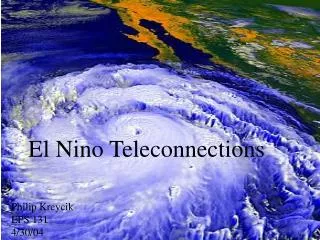
ENSO and other teleconnections. Fig. 10-19, p. 275. Fig. 10-19a, p. 275. Fig. 10-19b, p. 275. Fig. 10-20, p. 275. Fig. 10-21, p. 276. Fig. 10-21a, p. 276. Fig. 10-21b, p. 276. Tropical Atmosphere and Ocean

E N D
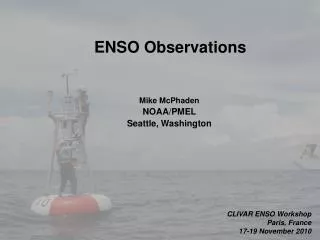
Tropical Atmosphere and Ocean The Research Moored Array for African–Asian–Australian Monsoon Analysis and Prediction* Prediction and Research Moored Array in the Atlantic
ENSO and PDO Figure 3 The impact of ENSO and PDO on Columbia River summer streamflow at The Dalles, Oregon for 1900-1999. The horizontal lines show average streamflow over each of the PDO epochs (cool: 1900-1925, warm: 1925-1945, cool: 1945-1977, warm: 1977-1995). The red dots are El Niño years, the blue dots are La Niña years, and the green dots are ENSO neutral years. The figure shows "naturalized" streamflow (i.e., with the effects of the dams numerically removed) for April-September of each year.
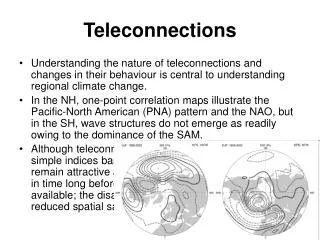
North Atlantic Oscillation Fig. 10-26, p. 280
Arctic Oscillation… Other Teleconnections http://www.cpc.ncep.noaa.gov/products/intraseasonal/z500_nh_anim.shtml Fig. 10-27, p. 280
Recent AO index http://www.ncdc.noaa.gov/teleconnections/ao.php
The Arctic Oscillation (AO) is a large scale mode of climate variability, also referred to as the Northern Hemisphere annular mode. The AO is a climate pattern characterized by winds circulating counterclockwise around the Arctic at around 55°N latitude. When the AO is in its positive phase, a ring of strong winds circulating around the North Pole acts to confine colder air across polar regions. This belt of winds becomes weaker and more distorted in the negative phase of the AO, which allows an easier southward penetration of colder, arctic airmasses and increased storminess into the mid-latitudes.
Explain why the west coast is relatively dry and the east coast in wet.