Download

1 / 88
910 likes | 1.24k Vues
Lab Medicine Conference Leucocytes, Erythrocytes, Platelets, and Clotting Studies. Lab Medicine Conference : Hematology : Topics Covered. Methodology & indications for : White blood cell count Differential cell count Peripheral blood smears Hemoglobin, hematocrit Platelet count

E N D
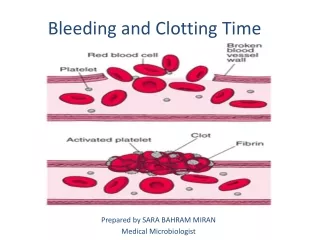
Lab Medicine Conference Leucocytes, Erythrocytes, Platelets, and Clotting Studies
Lab Medicine Conference : Hematology : Topics Covered • Methodology & indications for : • White blood cell count • Differential cell count • Peripheral blood smears • Hemoglobin, hematocrit • Platelet count • Prothrombin Time • Partial Thromboplastin Time • Thrombin Time, Bleeding Time
Components of the Complete Blood Count (CBC) • Hemoglobin • Hematocrit • Red blood cell count • Red blood cell indices • White blood cell count • Platelet estimate
White Blood Cell (Leucocyte) Counts : Background • One of most commonly ordered lab tests in E.D. • Classic example of a lab test of variable or low sensitivity & specificity • Consisit of separate cell lines : • Neutrophil • Lymphocyte • Basophil • Eosinophil • Monocyte - tissue macrophage
Categories of Neutrophils • Two categories in bone marrow : • Mitotic pool (precursors still capable of mitotic division) • Myeloblast promyelocyte myelocyte • Postmitotic pool • Metamyelocytes bands mature neutrophils (polymorphonuclear leucocytes or PMN's) • Is the storage pool for neutrophils & represents 15 to 20 times the circulating population
Body Distribution of Neutrophils • Maturation sequense from myeloblast to PMN takes 5 to 7 days • Mature PMN's released from marrow into circulation • About 1/2 circulate freely (circulating PMN pool) & 1/2 adhere to blood vessel walls (marginal PMN pool) • PMN's carry out their phagocytic functions in extravascular sites (in tissue) & then do not return to circulation
Body Distribution of Lymphocytes • Peripheral lymphocytes represent only 5 % of total body pool • Cells mature in bone marrow, thymus, spleen, lymph nodes, & other lymphoid collections • Cells can freely enter & leave circulation • Consist of three cell subtypes : T cells, B cells, & null cells
Factors Affecting the Peripheral Leucocyte Count • Lymphoid, marrow, circulating, marginal, & tissue pools of leucocytes are in dynamic flux • Rate at which new cells enter vascular system normally equals the loss into tissues • 3 determinants of peripheral leucocyte count : • Relative rates of marrow & lymphoid production • Cell margination • Tissue consumption
Methods of Lab Measurement of Total Leucocyte Counts • Older manual methods had variance of 20 % • Modern automated methods have variance of 4 % • Automated counting methods : • Electrical impedance • Darkfield optical
Electrical Impedance Method Used by the Coulter Counter • WBC's suspended in electrically conductive media which also lyses the erythrocytes • This suspension flows thru aperture located in insulated strip separating two electrodes • Aperture allows only single cell to pass at a time • Each cell causes reduction in electrical flow proportional to the cell's volume • Changes in the electrical flow then quantitate the number of leucocytes
Darkfield Optical Technique for Measuring Leucocyte Counts • Diffraction of a light beam is caused by a thin column of suspended cells passing at the microscopic focal point • Diffracted impulse is used to determine the cell count • Knowing concentration of the diluent, result then expressed as cells per microliter
Stains for Determination of Leucocyte Differential Count • Manual exam under microscope • The most time consuming part of heme exam • Uses either Wright's or May-Gruenwald- Giemsa stain • Both contain methylene blue & eosin • Acid components of cells stain with methylene azures & basic components take up eosin • Different stain uptake by cell granules allows cell type differentiation
Problems with "Manual" Method for Leucocyte Differential Counts • Time consuming • Poor precision • > 15 % variation in same sample checked by same person at different times • Only 100 to 500 cells counted • Cell type distribution varies from edge of smear to middle • At a pathologists' convention, 50 % called a test cell a band & 50 % called it a poly
Continuous Flow Cytochemistry Automated Method for Leucocyte Differential Measurement • Cells flow thru 3 channels where RBC's are lysed & WBC's stained supravitally • Stains evaluate presence of peroxidase, esterase, & basophilic granules • Cell size & staining uptake identified by light absorption & light scattering properties of cell • Counts 10,000 cells per sample so precision is improved over manual methods (which count 100 to 500 cells) • False positive cell identification rate is about 10 % & false negative rate is 0.8 to 10 %
Coupling of Coulter Channelizer to Standard Coulter Counter • Allows rapid differential counts independent of operator supervision • Cells are sorted by electrical impedance & grouped according to cell volume • Bimodal cell volume distribution results • Heavier cells are granulocytes (neutrophils, eosinophils, & monocytes) • Second peak represents lymphocytes • Can be done at rate of 100 runs per hour
Quantitative Analysis of Buffy Coat to Determine Differential Count • Capillary tube containing a plastic cylinder is centrifuged (the plastic cylinder is needed to augment height of the buffy coat) • Buffy layer then separated into lymphocytic & granulocytic elements by staining with acridine orange • Multiplication of column heights by predetermined constants yields neutrophil & lymphocyte percentages
Effects of Age on Normal Leucocyte Counts • Total leucocyte count peaks in first 12 hours of life, then generally declines till adult level reached at age 21 years • Absolute neutrophil counts (total WBC count multiplied by % of neutrophils) : • 10,000 /mm3 at birth • 3500 /mm3 at age 2 years • 4400 /mm3 age 3 to adult • Lymphocytes peak at 7000/mm3 at age 1 year
Gender and Race Effects on Leucocyte Counts • Premenopausal female levels average 500 per mm3 more than males • 1000 /mm3 increase in total count with pregnancy • Black women & children ages 1 to 5 have total counts lower by 1000 cells /mm3 • Smokers may have chronic elevation of 1000 to 1800 cells /mm3
Lab Problems Causing Errors in Leucocyte Counts • Uneven distribution of WBC's in peripheral portions of slide smear • Incomplete RBC lysis causes false high count • WBC lysis causes false low count • Clumping of platelets causes false high count • Improper dilution causes 2 cells to be counted as single cell
Average Total Leucocyte and Differential Counts for U.S. Adults Ages 25 to 74 Para - meter Total Leuco- cytes Seg- mented Neutro- phils Band Neutro- phils Lymph- ocytes Mono- cytes Eosino- phils Baso- phils # of Cells in Billions per Liter 7.6 +/- 0.06 4.51 +/- 0.05 0.02 2.69 +/- 0.04 0.22 +/- 0.02 0.15 +/- 0.01 0.01 Percent of 100 Cells 58.9 +/- 0.36 0.2 35.9 +/- 0.41 2.9 +/- 0.19 2.0 +/- 0.06 0.1
Mean and Ranges of Normal Leucocyte Counts at Different Ages MONO- CYTES TOTAL WBC'S EOSIN- OPHILS NEUTROPHILS LYMPHOCYTES AGE MEAN (RANGE) MEAN (RANGE) Percent MEAN (RANGE) Percent MEAN (%) MEAN (%) BIRTH 18.1 (9 to 30) 11.0 (6 to 26) 61 5.5 (2 to 11) 31 1.1 (6) 0.4 (2) 1 Week 12.2 (5 to 21) 5.5 (2 to 10) 45 5.0 (2 to 17) 41 1.1 (9 ) 0.5 (4) 1 Month 10.8 (5 to 20) 3.8 (1 to 9) 35 6.0 (2 to 17) 56 0.7 (7 ) 0.3 (3) 1 Year 11.4 (6 to 18) 3.5 (2 to 9) 31 7.0 (4 to 11) 61 0.6 (5 ) 0.3 (3) 6 Years 8.5 (5 to 15) 4.3 (2 to 8) 51 3.5 (2 to 7) 42 0.4 (5 ) 0.2 (3) 21 Years 7.4 (4 to 11) 4.4 (2 to 8) 59 2.5 (1 to 5) 34 0.3 (4) 0.2 (3)
Methods of Blood Smear Preparation • Coverslip method • 2nd coverslip placed on drop of blood on first slip & rotated 45 degrees ; slips then pulled apart horizontally ; usually produces even blood film • Slide method • Edge of slide pushed away from drop of blood on base slide ; disadvantage is uneven distribution of WBC's in tapered smear • Spinner method • Centrifuge spins slide briefly at 5000 rpm ; can be used with automated differential analyzers
Choices for Blood Stains • Rowmanowsky types contain basic (thiazine) and acidic (eosin) components • Wright's stain : most common • Has methyl alcohol, eosin, thiazines (azure B, etc.) • Giemsa : useful for malaria • Leishman • May-Grunwald • Jenner • MacNeal
Appearance of Blood Components On a Properly Done Wright's Stain • Overall pink color • Erythrocytes : pink • Leucocyte nuclei : blue to purple • Neutrophil granules : violet • Eosin granules : red / orange • Basophil granules : blue to purple • Lymphocyte cytoplasm : light blue • Platelets : purple granules • Reticulocytes (immature RBC's) have RNA that stains blue as granules or reticulum within the cells
Neutrophil Appearance on Blood Smears • Mature cells have 2 to 4 nuclear lobes • Causes of hypersegmented (> 5 lobes) : • Megaloblastic anemia • Severe sepsis • Uremia • Myeloproliferative disorders • Metastatic malignancy • Heat stroke • Immature cells ("band" forms) : show increased % in response to acute inflammatory conditions, especially bacterial infections
Wright stain showing an S.L.E. cell (a polymorphonuclear leucocyte with phagocytized nuclei)
Characteristics of Atypical Lymphocytes • Seen in infectious mononucleosis • Large (12 to 16 microns in length) • Abundant finely granular cytoplasm • Nucleus is more variable in shape • Presence of small cytoplasmic vacuolations is the most characteristic feature
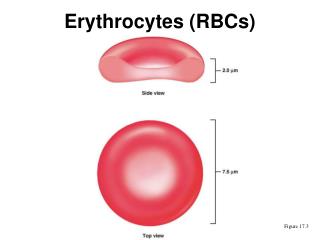
Physical Characteristics of Erythrocytes (RBC's) • Normal adult blood contains 5 million RBC's per microliter • 26 trillion RBC's = circulating red cell mass • Are anucleate biconcave discs • Each 6.7 to 7.7 microns in diameter • Internal cell volume is 80 to 100 femtoliters (10 L) • Each cell contains 250 million hemoglobin (Hgb) molecules • Hgb constitutes about 1/3 of total cell content -15
Erythrocyte Turnover • Produced mainly in marrow of ribs, vertebrae, skull, clavicles, & pelvis • Low O2 tension & reduced O2 carrying capacity stimulate erythropoetin • Cannot produce own proteins after maturation • 1 % of cells removed daily, mainly by spleen • Average cell lifespan 100 to 120 days
Variations in Hemogram Measurements from Different Blood Drawing Techniques • First capillary sample gives lower cell counts than subsequent samples • Ear lobe Hgb can be 15 % > fingerstick Hgb • If skin cold or squeezed, can cause 6 % higher values • In neonates, capillary Hgb is 3.5 g/dl > venous Hgb • Hemoconcentration results from tourniquet times > 60 seconds • Hemolysis can result from small needle draw or improper technique
Choices of Anticoagulants for Hemogram Measurements • EDTA (lavender top tube) : • Prevents platelet clumping • Agent of choice for blood cell counts & morphologic studies • Causes changes in RBC indices if analysis delayed > 6 hours • Trisodium citrate (blue top tube) : • Needs ratio of one part 3.8 % solution to 9 parts sample blood for effective anticoagulation • This is why tube must be fully filled for accurate result • Sodium heparin (green top tube) : • Best for hemolysis prevention & osmotic fragility tests • Causes cell clumping so is not good for cell counts • Causes blue background on Wright's stain
Methods for Red Cell Count Measurement • Manual • Blood sample diluted 1 to 200 with isotonic Hayem's Solution, them micropipetted into counting chamber (hemocytometer) • Number of RBC's in 1/5 square mm area counted & multiplied by 10,000 to yield number of cells per mm3 • Range of error for this method : +/- 20 % • Automated - most are multichannel (also calculate Hct) : • Electrical impedance (Coulter Counter, etc.) • Measure voltage change when cells displace conductive fluid • Light Scattering systems (Hemalog, Ortho, etc.) : • Measure voltage pulses that occur when cells interrupt a laser beam & scatter light onto a photodetector
Measurement Methods for Hemoglobin • Colorimetric methods have superceded specific gravity, gasometric, & chemical methods • Colorimetric methods measure photoelectric absorption of pigment derived from Hgb • Cyanomethemoglobin method is standard • Sample treted with KCN & absorption at 540 nm measured • Anything causing incresed sample turbidity (lipemia, etc.) can cause measurement errors • Accuracy is +/- 2 % • Expressed as grams per deciliter
Manual Measurement Techniques for Hematocrit (Hct) • Hct expressed as ml per ml, or % • Represents % of blood volume occupied by RBC's • Macrohematocrit method : • Large tube centrifuged for 30 minutes ; Hct then read by scale on tube • Allows measurement of sed rate & WBC counts on same sample • Microhematocrit method : • 7 cm length capillary tube (1 ml volume) used • End of tube sealed with clay after sample entered • Centrifuged for 4 minutes ; Hct then read by scale next to tube • Accuracy is +/- 2 % • Sometimes false elevation from plasma trapping
MCV : Mean Corpuscular Volume • Is average volume of single RBC • Calculated by : measure Hct & divide by RBC count • MCV < 80 femtoliters = microcytic • MCV > 100 femtoliters = macrocytic
MCH : Mean Corpuscular Hemoglobin • Is average weight or content of Hgb in single RBC • Determined by dividing measured Hgb by RBC count • Value expressed in picograms • MCH < 27 = microcytic or hypochromic normocytic • MCH > 31 = macrocytic • Helps to classify anemias as hypochromic or normochromic
MCHC : Mean Corpuscular Hemoglobin Concentration • Is average Hgb concentration in a given volume of packed RBC's • Determined by dividing Hgb content by Hct • Result is weight per 100 ml of packed RBC's, expressed as "%" • Has less independent correlation with RBC appearance on smear than does MCV or MCH • If < 30 % suggests severe iron deficiency • If > 38 % suggests hereditary spherocytosis • If > 40 % suggests error in RBC measurements
Hemogram Values for Different Ages (at sea level) Hemoglobin (gm / dL) Hematocrit ( % ) RBC Count (100,000 / uL) MCV (cubic microns) MCH (picograms) MCHC (gm / dL) Birth (cord blood) 17.1 +/- 1.8 52 +/- 5 4.64 +/- 0.5 113 +/- 6 37 +/- 2 33 +/- 1 1 Day 19.4 +/- 2.1 58 +/- 7 5.30 +/- 0.5 110 +/- 6 37 +/- 2 33 +/- 1 1 Month 14.1 +/- 1.9 45 +/- 7 4.35 +/- 0.6 104 +/- 11 32 +/- 3 31 +/- 3 3 Months 11.2 +/- 0.8 37 +/- 3 3.88 +/- 0.4 95 +/- 9 29 +/- 3 30 +/- 2 5 Years 12.7 +/- 1.0 37 +/- 3 4.65 +/- 0.5 80 +/- 4 27 +/- 2 34 +/- 1 Adult Men 15.5 +/- 1.1 46 +/- 3 5.11 +/- 0.4 90 +/- 5 30 +/- 2 34 +/- 1 Adult Women 13.7 +/- 1.0 41 +/- 3 4.51 +/- 0.4 90 +/- 5 30 +/-2 34 +/- 1
Reticulocyte Counts • Normally comprise 0.5 to 1.5 % of all erythrocytes • Reflects release of young RBC's from marrow • Marrow failure is reflected by low retic count : • Iron deficiency • Thalassemia • Aplastic anemia • Calculation of reticulocyte index (RI) allows correction of % for decreased hematocrit : • RI = reticulocyte % X Hct / Normal Hct • ( Normal Hct entered as 45 to 48 %) • Normoblasts = nucleated RBC's (pre-retic precursor) • normally not seen on peripheral smear
Additional Lab Tests Useful in Diagnosis of Hemolytic Anemias • Unconjugated bilirubin : elevated • Haptoglobin levels decreased • Alpha-2 macroglobulin normally at high levels in plasma • Binds to free Hgb ; complex actively cleared by monocytes • Once haptoglobin binding capacity exceeded, free Hgb levels increase & Hgb is filtered into urine • Filtered Hgb is catalyzed into hemosiderin causing hemosiderinuria • Hemoglobinuria then results if hemolysis is more severe exceeding capacity to make hemosiderin
Diagnostic Interpretations of Hemogram Measurements • MCHC > 38 % without spherocytes present suggests inaccuracy of all CBC values due to cold agglutinins, lipemia, or rouleaux formation • Hct < 25 implies not anemia of chronic disease alone • MCV < 80 indicates chronic iron deficiency or thalassemia minor • Hypochromic normocytic anemia implies plumbism (lead toxicity) • MCV > 120 implies liver disease or megaloblastic anemia
Red Cell Distribution Width (RDW) • Reported by newer automatic RBC counter machines • Provides distribution frequency of red cell volume • RDW = standard deviation of measured RBC size X 100 / MCV • RDW = coefficient of variation (CV %) of RBC size • Normal RDW = 11.5 to 14.6 % (can be high but not low) • Error is +/- 0.5 %
Diagnostic Use of RDW • Nutritional deficiency (iron, folate, or B12) results in dimorphic subpopulation of RBC's • RDW then is high (even if MCV & Hgb are normal) • RDW is normal with hypoproliferative anemias and reticulocytosis • Usually is normal with hemorrhage
Polycythemias • Defined as increase in number of circulating RBC's per unit volume of blood • Classed as : • Absolute increase in red cell mass : • Primary (Polycythemia vera) • Secondary (chronic hypoxia, etc.) • No increase in total red cell mass : • Relative (hemoconcentration from loss of plasma) • Stress • Pseudopolycythemia
Polycythemia Vera Diagnostic Criteria • Normal O2 saturation • Thrombocytosis : platelets > 600,000 / mm3 • Leucocytosis : WBC > 12,000 / mm3 • Leucocyte alkaline phosphatase > 100 • Elevated B12 levels • Usually splenomegaly present • Symptoms related to increased blood volume & increased blood viscosity
Morphologic Variants of Erythrocytes Red Cell Variant Major Clinical Associations Acanthocyte Abetalipoproteinemia Alcoholic cirrhosis with hemolysis Basophilic stippling Lead poisoning, thalassemia Hemolytic states Blister cells DIC Sickle cell disease Burr cells (echinocytes) Uremia Renal disease, Pyruvate kinase deficiency Elliptocytes Hereditary elliptocytosis ( a few may be seen on normal smears) Heinz bodies (denatured Hgb) Drug - induced oxidative hemolysis Unstable hemoglobinopathies Howell-Jolly bodies (nuclear fragments) Hemolytic anemias, Megaloblastic anemia Hyposplenism, Thalassemia Macroovalocytes Megaloblastic anemia Myeloproliferative disease Nucleated RBC's Increased erythropoesis ( blood loss or hemolysis)


![ERYTHROCYTES [RBCs]](https://cdn3.slideserve.com/5385917/erythrocytes-rbcs-dt.jpg)
![ERYTHROCYTES [RBCs]](https://cdn3.slideserve.com/6667616/erythrocytes-rbcs-dt.jpg)