Investing in Library Media Centers for Academic Success: Research Findings and Budget Analysis
This study explores the impact of investment in Library Media Centers on academic achievement. Findings from schools in Pennsylvania and Colorado reveal the importance of staffing and material resources. Budget comparisons across five states highlight the correlation between investment in LMC materials and student success. The study emphasizes the significance of staffing levels and resource allocation for LMC effectiveness and student outcomes.

Investing in Library Media Centers for Academic Success: Research Findings and Budget Analysis
E N D
Presentation Transcript
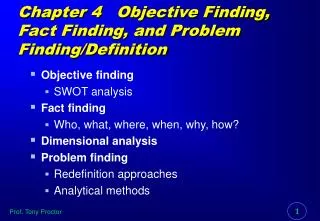
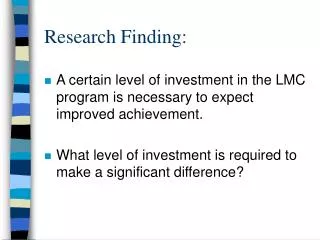
Research Finding: • A certain level of investment in the LMC program is necessary to expect improved achievement. • What level of investment is required to make a significant difference?
Lance Findings in Two States • Pennsylvania (2000) 435 schools • Colorado (2000) 200 schools
Comparison of 25 Top Scoring vs. 25 Lowest Scoring Schools • Staffing in Pennsylvania • Professional staff hours/week • 5th grade 34.31 vs. 29.36 17% difference • 8th grade 38.40 vs. 37.63 2% difference • 11th grade 45.06 vs. 43.25 4% difference • Support staff hours/week • 5th grade 25.92 vs. 12.48 108% difference • 8th grade 30.30 vs. 15.80 92% difference • 11th grade 49.57 vs. 19.28 157% difference
Conclusion in Pennsylvania • Support staff was the key difference between strong and weak library media programs. • That is, professionals alone cannot make a major difference because of the load of clerical and technical work.
Finding in Colorado • Total library media staff hours/100 students • 4th grade 14.67 vs. 9.38 56% difference • 7th grade 13.00 vs. 10.72 21% difference
Conclusion for Colorado: • The total LMC staff size contributes to academic achievement.
Budget investment for five states • Pennsylvania • Colorado • Texas • Iowa • New Mexico
25 Highest Scoring vs. 25 Lowest Scoring Schools • Pennsylvania budget for LMC materials • 5th grade $7,240 vs. $4,928 • 47% difference in scores • 8th grade $14,506 vs. $8,386 • 73% difference in scores • 11th grade $23,730 vs. 14,197 • 67% difference in scores
LMC Materials Expenditures per StudentSelected States & Grade Levels
Conclusion • In all states studied, higher achieving schools spend more on materials for their library media programs.
Materials available in the LMC in six states • Pennsylvania • Colorado • Texas • Oregon • Iowa • New Mexico
25 Highest Scoring vs. 25 Lowest Scoring Schools • Pennsylvania print volumes • 5th grade 10,857 vs. 8,876 • 22% difference in scores • 8th grade 13,507 vs. 10,744 • 26% difference in scores • 11th grade 15,474 vs. 14,499 • 7% difference in scores
Volumes Per CapitaHighest & Lowest ScoringSchools in CO, TX, OR, IA & NM
Conclusion • Stronger LMCs have richer print collections and this contributes to academic achievement. • They also have stronger periodical and electronic collections