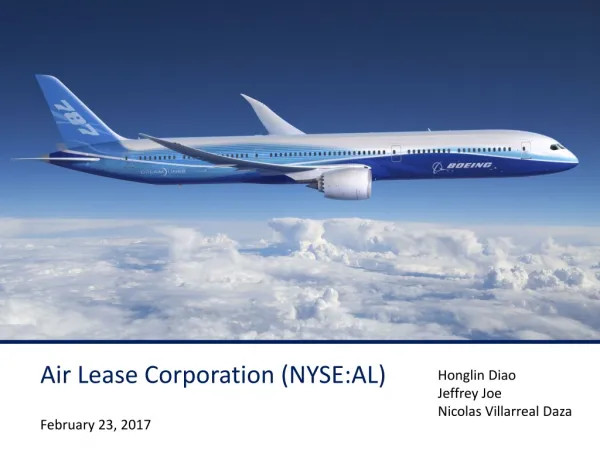
Air Lease Corporation (NYSE:AL)
Air Lease Corporation (NYSE:AL). Honglin Diao Jeffrey Joe Nicolas Villarreal Daza. February 23, 2017. Agenda. Air Lease Snapshot. Air Lease (AL) Headquarters – Los Angeles, CA Current Price $39.57 (February 15, 2017) IPO Price $26.50 (April 19, 2011) Offer amount $803M P/E 11.64x

Air Lease Corporation (NYSE:AL)
E N D
Presentation Transcript
Air Lease Corporation (NYSE:AL) HonglinDiao Jeffrey Joe Nicolas Villarreal Daza February 23, 2017
Air Lease Snapshot • Air Lease (AL) • Headquarters – Los Angeles, CA • Current Price $39.57 (February 15, 2017) • IPO Price $26.50 (April 19, 2011) Offer amount $803M • P/E 11.64x • 52 weeks high $40.20 • We own 300 shares, Gain: +78% since our purchase of 400 shares on 12-18- 2012 at $22.32 (sold 100 at $29.80 on 10-25-2016) Air Lease VS S&P 500 cumulative return
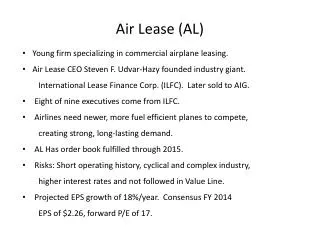
Airline Industry is Growing • Air leasing is a sector of airline industry • The estimated return of investment return in air leasing is 5% per year1 • Airline industry growth is strongly correlated to world economy growth • Emerging market shows outperformance in aircraft demand APAC China Source: Ascend FlightglobalForcast Source: IATA Source: World Banks
Strong Demand For Air Leasing Number of future aircraft needed • Increasing demand for new planes and replacement of old planes • Better to rent than to hold, operation leasing expense is 3.8% of overall revenues and plane prices increase by 2% per year • More cash and resources can be assigned to marketing and expansion • The ratio of operating leasing aircrafts to total aircrafts is expected to be nearly 53%in 2025 • In 2016, around 7,900 planes are owned by air lessors Source: IATA Source: Boeing, current market look 2016-2035 Operating leasing Operating leasing Source: Flightglobal Fleet Analyzer Source: Boeing & Airbus
Competitors In Air Leasing 158 70 Source: Flightglobal Fleet Analyzer • By December 2015, 158 operating lessors managed commercial aircraft with 100 seats and more • Merger transactions occur among air leasing companies in order to acquire larger market share • Air leasing is highly dependent on external financing such as loans Source: Moody’s, Standard &Poor’s, Fitch
Market Risk Fuel price risk Interest rate risk Business cycle risk • Oil expense is about 6.8% of overall revenues • If oil prices go down, airline companies will prefer not to replace the old and less fuel efficient planes, leading to less demand for air leasing • Air leasing companies gain revenues from the increasing demand of aircraft rental • Number of new aircraft purchased decreases as the economy slows down • Average debt to assets ratio in air leasing industry is about 60-70% • Slight changes in interest rate will add extra burden and reduce profit margin • Interest rate has been relatively low since 2008 and it has been rising since 2015 Change in oil prices Change in interest rate Source: WTI Crude Oil Source: IATA Source: FRED
Management Overview Steven Udvar-Házy, Executive Chairman John Plueger, CEO and President
Business Model Boeing and Airbus Airlines Worldwide Air Lease Corporation BUY LEASE SELL Own new aircraft for 1/3 of 25 year useful life Negotiate long-term lease from order book Enter lease agreement 18-36 months in advance 3.7 years of weighted average fleet age 6.9 years of weighted average remaining lease term Airlines Worldwide
Air Lease Aircraft Source: Air Lease 2016 3Q financial report
Air Lease Customers Market allocation Source: Air Lease 2016 3Q financial report
Air Lease Competitors • AER • Dublin, Ireland • Market cap 8.66B • Owns 1,109 aircraft, serves 200 lessees in 80 countries, manages 141 aircraft • Leasing and sales of aircraft, also provides aircraft services and engine leasing • AYR • Stamford, CT • Market cap 1.94B • Owns 206 aircraft, serves 71 lessees in 36 countries • Leasing and sales of aircraft, also provides aircraft maintenance and financing • FLY • Dun Laoghaire, Ireland • Market cap 459.5M • Owns 80 aircraft, serves 44 lessees in 28 countries • Leasing and sales of aircraft
Porter’s Five Forces Analysis • Suppliers are more concentrated • Main suppliers are Airbus and Boeing • Limited annual production of aircraft • Suppliers may receive government benefits • Requires large capital costs • Strict regulatory environment • High operating costs • Experienced management required Bargaining power of suppliers High Threat of new entrants Low Competitive Rivalry High Threat of substitutes Low Bargaining power of buyers Moderate • Industry concentrated • Growing demand for aircraft leasing • Customers are able to switch companies • Competitors may receive tax benefits • No real substitute for jet aircraft • Increasing reliance on air travel • More airlines using leasing • Emerging markets utilize leasing • Buyers are less concentrated • Buyers can purchase new or used • Advanced orders required • Buyers may receive tax benefits
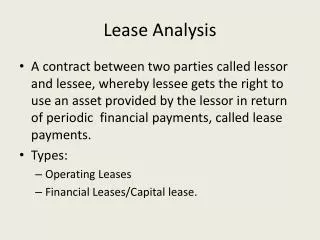
It’s a Capital-Intensive Business • Airplanes life expectancy: 25 Years • Air Lease sells the plane in a bundle (plane + lease) after 8 years • Lease contracts are negotiated 18-36 months prior to acquisition of a new plane • Operating leases • Triple net leases (operation, insurance and maintenance)
ROE/ROIIC May Not Meet Expectations DUPONT Analysis (2016) X X X X = Interest Burden EBIT Margin Asset Turnover Tax Burden Leverage ROE
AL is a Commitment to Long Term Value • Both liquidity and investment needs have been supplied by debt (LT debt or WK debt) • High profit margins don’t translate into excess cash, as the company is investing heavily in asset acquisition • Given the management’s investment plan, we don’t expect to see positive cash flows for the upcoming 4 years
We Believe Markets Will Mean-Reverse Historic Triple BBB Yields 6.5 5.7 4.8 Scenario 2: Recent History Scenario 1: Long-Term Mean Reversion S&P P/E Ratio: 24.6x Dow Trans P/E Ratio: 19.2x Kd Kd 6.3% 4.7% Market Implied Cost of Equity 6.7 – 7.7% Ke Ke Historic S&P Return 10% 14.0% 12.7%
Three Different Valuation Approaches DCF Over 100% CAPEX for growth 70% debt financing 5% revenue CAGR Current Price: $40 Target One-Year Price: $36 Capital Gains: -9% Dividend Yield: 0.8%
Scenarios: Markets Will Mean-Reverse? Target one year price Current price
Our Recommendation: To Sell 300 shares @ market price
We Recommend Selling at Market Price High degree of leverage (2.5x) High gearing (>60% debt to assets) Capital-intensive business Long-term value Intensive financing risk We believe market is going to mean-reverse Strong experienced management Stable industry and growing sector Young company investing to grow Excellent lease placement rate (>95%) Operational risk-free Best credit rating when compared to peers 87% -5%