Download
1 / 28
280 likes | 414 Vues
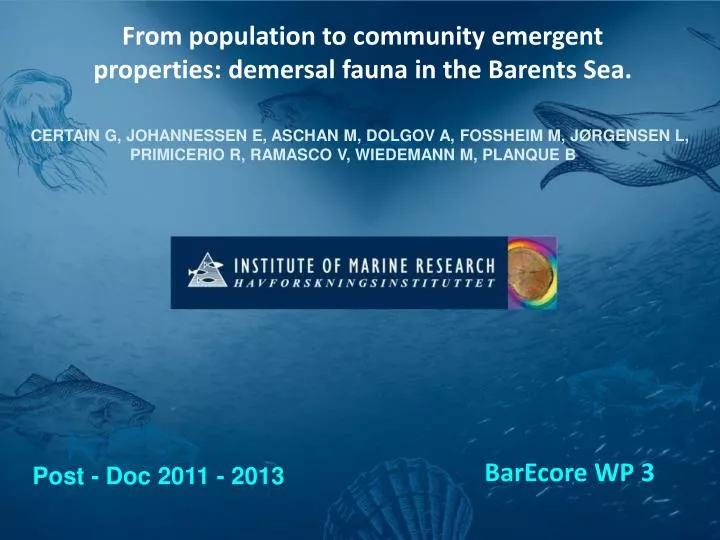
From population to community emergent properties: demersal fauna in the Barents Sea. CERTAIN G, JOHANNESSEN E, ASCHAN M, DOLGOV A, FOSSHEIM M, JØRGENSEN L, PRIMICERIO R, RAMASCO V, WIEDEMANN M, PLANQUE B . BarEcore WP 3. Post - Doc 2011 - 2013.

E N D
From population to community emergent properties: demersal fauna in the Barents Sea. CERTAIN G, JOHANNESSEN E, ASCHAN M, DOLGOV A, FOSSHEIM M, JØRGENSEN L, PRIMICERIO R, RAMASCO V, WIEDEMANN M, PLANQUE B BarEcore WP 3 Post - Doc 2011 - 2013
The main tools used to predict the effect of Global Change on the distribution of species are “Species Distribution Models” (SDMs)
What are these SDMs? response(pop Y at space s and time t) randomerrors Yst = f(θst) + εst Theyarestochasticmodelsonthe form: covariates(θ) Whatecologistsusually do ? θ = climate= To + anyotheravailablemeasure species #1 = f(To, S‰, …) + ε, species#2 = f(To, S‰, …) + ε, species #3 = f(To, S‰, …) + ε, Etc … Applyingthisreasoninglead to ”stack” modelpredictionsbuiltwitha uniquesetofcovariates. Are thesepredictionsstill realisticat thecommunitylevel?
Joining population-based and community-based models: Guisan & Rahbek (2011) Such an approachrelyoncommunity-relatedproperties, amongwhichspeciesrichness is the most commonmetric.
Thesecommunity-related ”properties” have beenreviewed by Mc Gill (2010) • According to theoreticalmodels, • A naturalcommunityshows: • Interspecificvariation in abundances: theSpeciesAbundanceDistribution (SAD) curve. • Intraspecificclumping: Communityarecomposedofspatiallycorrelatedpopulations. • Interspecificrandomness: Speciesarerandomlydistributedconditionally to eachother. Empirical tests ? (1) And (3)can be viewed as ”emergent” propertiesat thecommunitylevel, while(2) is expressed at thepopulationlevel.
Howincorporatingcommunity-related SADwithin a population-relatedmodellingframework?
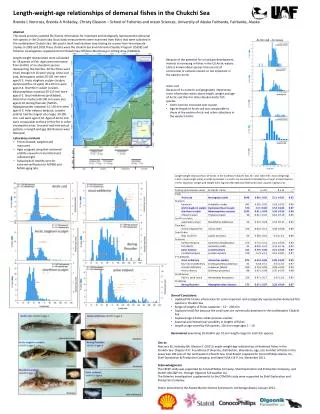
Data: Standardised (30mn) bottomtrawl sampling For each species in the trawl, Numbers, Biomasses, Length (some) Data available: 2004 – 2009 (August) Weconsider 111 species: 109 fishes + 2 crustaceans(Pandalusborealis& Sclerocrangonferox)
Environmental covariates Model-basedcovariates: 2004 - 2008 Temperature(surface, bottom) Salinity(surface, Bottom) Satellite-basedcovariates: 2004 - 2009 Productivity (CHLasurface) Icecoverage Depth / Slope
So, what is a SAD ? ”SAD” meansthatsomespeciesare abundant and someare rare. This is usuallyshowedthroughtheSpeciesAbundanceDistributioncurve. Abundant species Logabundance Rare species Rank inabundance
The poissonlog-normalmodel (PLN) Increase in variance The PLN has two parameters,μthemeanand σ2thevariance Increase in mean Y axis - Log abundance μand σ2controltheshapeofthe SAD X axis - Rank in abundance
Fitting PLN for eachtrawlsample μ μ= 5.06 - 1.48 *σ2+ ε ε~Ɲ (0, 1.24) can be viewedas a spatiallyautocorrelatedgaussianrandomfield σ2 2004 2005 2006 2007 2008
Modellingenvironmentalforcingon σ2 Modellingframework: GAMs Modelselection: forward Selectioncriterion: RMSE Modelbuilding: 2004 – 2006 Modelevaluation: 2007 – 2008 12 Covariatesaretested: bottomdepth, slope Surfacetemperature(mean 2004-2008; year to yearanomaly) Surfacesalinity(mean 2004-2008; year to yearanomaly) Bottomtemperature(mean 2004-2008; year to yearanomaly) Bottomsalinity(mean 2004-2008; year to yearanomaly) SurfaceChla Numberofice-coveredmonthin the last 10 monthbeforethe survey Terms selected: # 1 s(surfacesalinityanomaly, surfacetemperatureanomaly) # 2 s(bottomdepth, slope) # 3 s(icecoverage)
Modelled Trend for σ2 Modelpredictions: deterministiccomponentoftheσ2 (~15% data deviance) 2004 2005 2006 2007 2008 ModelResiduals: stochasticcomponentoftheσ2 ε~Ɲ (0, 0.79) can be viewed as aspatiallyautocorrelatedgaussianrandomfield. 2004 2005 2006 2007 2008
To summarise: The relative abundancesofspeciescomposing a communitycan be modelled by the PLN. The parameters ofthe PLN, μ and σ2are inter-relatedanddeterminedby theenvironment, have stochasticautocorrelatedcomponents. μ= -1.48*σ2 + 5.06 + Ɲ (0,1.24) σ2 = f (environment) + Ɲ (0,0.79) withthisframework, under theassumptionsthatstochasticcomponentsare invariant through time, wecanproject theshapeofthe SAD curves under variousclimatic scenarios.
Howcanweuse SAD predictionswithinspeciesdistributionmodels ? Whenthe PLN is known, (relative) abundancescan be predictedifwe know the rank ofthespecies Weneed to developSDMsthatfocusesonthe rank ofspecies Log abundance Rank in abundance
Conclusionson SAD: The SAD is a promising, operationalcriterionto control, at thecommunitylevel, SDM at thepopulationlevel. S Observed Fitting SAD has otheradvantages: correctingestimatesofspeciesrichness for example S Estimated Furtherinvestigationsoftheassertion (3) ofMc Gill, inter-specificcorrelationstructure,shouldalso be considered
More onMcGill’sassertion (3) : Speciesarerandomlydistributedconditionally to eachother. This assertion first requiresempiricalevidence
Testing correlationbetweenspatiallyautocorrelatedvariables Example in 2004: Shrimp Vs Cod(log scale) Botharespatiallyautocorrelated One way is to assesscorrelationwithpermutation: P (Cobs > Cperm)
Permutationswithrespect to the spatial structure Ex: wemodeltheshrimpspatial structurewith (1) a general trend and (2) a variogrammodelontheresiduals large scale trend 999 Unconditionalsimulationsoftheresiduals residuals A setofsimulatedshrimp data withthe same trend, and the same spatial structure in theresiduals
Wecancomputesimulatedcorrelationswiththesetofsimulatedshrimp data Theobservedcorrelationis < to most simulatedcorrelation: this suggest a negative correlationbetweenCodandShrimpin 2004 P-value (P Cobs>Csim) = 0.03
Ifspeciesaretrulyrandomlydistributedconditionally to eachother, whencalculating all thespecies*speciescorrelations, theP-valuesshould be uniformlydistributedbetween 0 and 1
Weobserve more negative and positive spatial associationsthanexpected under a random scenario…
In theBarentsSeaDemersalCommunity, speciesare NOT randomlydistributed to eachotherbut shows a clearinter-specificcorrelationstructure This inter-specificcorrelationstructureremains to be modelled (a Beta distribution offers a reasonablefitthough), HowthismodelmightconstrainSDMsis still unclear.
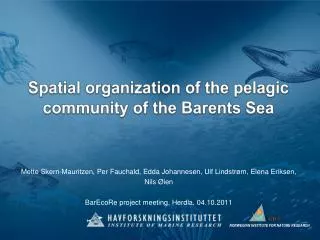
Assertion (2): Intraspecific clumping; Thatmeansthatthe spatial distributionofspeciesshould be spatiallyautocorrelated. Spatial autocorrelation Spatial randomness Spatial autocorrelationcan be investigatedwithvariograms variance distance
In thespecific case oftheBarentsSea, I have computedthevariogramsthroughspace and time. Not onlythe spatial distance is considered, butalsothe temporal distance T (in years). 42 species (the most abundants) weretested.
38 out of 42 tested species showed a significant clumping in space at T=0, but the degree to which spatial autocorrelation was persistent trough time varied across species. Intraspecificclumping in space and time Is importantwithin most ofthepopulations, and shouldprobably be takenintoaccount at themodelling stage.
Weuse a list of 111 speciescounted during theecosystem survey (109 fish + 2 invertebrates) GADICULUS_ARGENTEUS MICROMESISTIUS_POUTASSOU MERLUCCIUS_MERLUCCIUS GYMNELUS_VIRIDIS GYMNELUS_RETRODORSALIS LYCENCHELYS_SARSII LYCENCHELYS_MURAENA LYCENCHELYS_KOLTHOFFI LYCODES_POLARIS LYCODES_EUDIPLEUROSTICTUS LYCODES_SEMINUDUS LYCODES_PALLIDUS LYCODES_RETICULATUS LYCODES_ROSSI LYCODES_ESMARKII LYCODES_FRIGIDUS LYCODES_LUETKENII LYCODES_SQUAMIVENTER LYCODES_ADOLFI LYCODES_GRACILIS LYCODES_PAAMIUTI PANDALUS_BOREALIS SCLEROCRANGON_FEROX LETHENTERON_JAPONICUM SOMNIOSUS_MICROCEPHALUS ETMOPTERUS_SPINAX AMBLYRAJA_RADIATA AMBLYRAJA_HYPERBOREA DIPTURUS_BATIS RAJELLA_FYLLAE DIPTURUS_LINTEUS BATHYRAJA_SPINICAUDA CHIMAERA_MONSTROSA SYNAPHOBRANCHUS_KAUPII CLUPEA_HARENGUS SALMO_SALAR MALLOTUS_VILLOSUS OSMERUS_EPERLANUS NANSENIA_GROENLANDICA LEPTAGONUS_DECAGONUS CAREPROCTUS CAREPROCTUS_REINHARDTI CYCLOPTEROPSIS_MCALPINI EUMICROTREMUS_DERJUGINI EUMICROTREMUS_SPINOSUS LIPARIS_GIBBUS LIPARIS_FABRICII LIPARIS_TUNICATUS LIPARIS_MONTAGUI RHODICHTHYS_REGINA PARALIPARIS_BATHYBIUS CYCLOPTERUS_LUMPUS ANARHICHAS_DENTICULATUS ANARHICHAS_LUPUS ANARHICHAS_MINOR LUMPENUS_FABRICII LUMPENUS_LAMPRETAEFORMIS LEPTOCLINUS_MACULATUS ANISARCHUS_MEDIUS AMMODYTES ZEUGOPTERUS_NORVEGICUS LEPIDORHOMBUS_WHIFFIAGONIS GLYPTOCEPHALUS_CYNOGLOSSUS HIPPOGLOSSOIDES_PLATESSOIDES LIMANDA_LIMANDA MICROSTOMUS_KITT PLEURONECTES_PLATESSA REINHARDTIUS_HIPPOGLOSSOIDES HIPPOGLOSSUS_HIPPOGLOSSUS ARGENTINA_SILUS MAUROLICUS_MUELLERI ARCTOZENUS_RISSO BENTHOSEMA_GLACIALE LOPHIUS_PISCATORIUS ARCTOGADUS_GLACIALIS BOREOGADUS_SAIDA ELEGINUS_NAWAGA GADUS_MORHUA POLLACHIUS_VIRENS POLLACHIUS_POLLACHIUS BROSME_BROSME MELANOGRAMMUS_AEGLEFINUS ENCHELYOPUS_CIMBRIUS PHYCIS_BLENNOIDES TRISOPTERUS_ESMARKII MERLANGIUS_MERLANGUS MOLVA_MOLVA GAIDROPSARUS_ARGENTATUS LYCODONUS_FLAGELLICAUDA CORYPHAENOIDES_RUPESTRIS CAELORINCHUS_OCCA MACROURUS_BERGLAX GASTEROSTEUS_ACULEATUS PUNGITIUS_PUNGITIUS ENTELURUS_AEQUOREUS SCORPAENIDAE SEBASTES_MARINUS SEBASTES_MENTELLA SEBASTES_VIVIPARUS ICELUS ICELUS_BICORNIS ICELUS_SPATULA ARTEDIELLUS_ATLANTICUS GYMNOCANTHUS_TRICUSPIS MYOXOCEPHALUS_SCORPIUS TRIGLOPS_PINGELII TRIGLOPS_MURRAYI TRIGLOPS_NYBELINI COTTUNCULUS_SADKO AGONUS_CATAPHRACTUS ULCINA_OLRIKII