Download
1 / 14
140 likes | 265 Vues
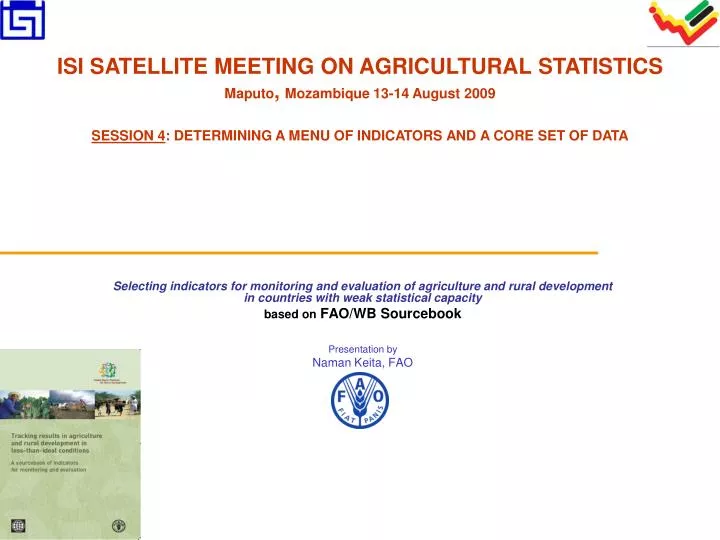
ISI SATELLITE MEETING ON AGRICULTURAL STATISTICS Maputo , Mozambique 13-14 August 2009 SESSION 4 : DETERMINING A MENU OF INDICATORS AND A CORE SET OF DATA. Selecting indicators for monitoring and evaluation of agriculture and rural development in countries with weak statistical capacity

E N D
ISI SATELLITE MEETING ON AGRICULTURAL STATISTICS Maputo, Mozambique 13-14 August 2009 SESSION 4: DETERMINING A MENU OF INDICATORS AND A CORE SET OF DATA Selecting indicators for monitoring and evaluation of agriculture and rural development in countries with weak statistical capacity based on FAO/WB Sourcebook Presentation by Naman Keita, FAO
THREE PILLARS OF THE GLOBAL STRATEGY • MENU OF INDICATORS AND SET OF CORE DATA • INTEGRATION OF AGRICULTURAL STATISTICS INTO NATIONAL STATISTICS SYSTEM • AGREED SUITE OF METHODOLOGIES FOR INTEGRATION
INDICATORS AND DATA/STATISTICS IN THE GLOBAL STRATEGY • An indicator provides a broad signal of change, direction, or state of being. • The statistics are the numbers that represent each indicator for a point in time, scope, and coverage • The data items are those needed to provide the statistics describing each indicator. • The data include the crop area, yield entering into the estimate of production of each crop, livestock numbers for meat production, etc.
FAO/WB SOURCEBOOK • FOCUSES ON: • HOW TO MONITOR AND EVALUATE (MEASURE) THE IMPACT OF AGRICULTURE AND RURAL DEVELOPMENT POLICIES IN COUNTRIES WITH WEAK STATISTICAL CAPACITY • DEFINE A FRAMEWORK OF STANDARDISED APPROACHES FOR SELECTING INDICATORS • DEFINE A MENU OF 86 INDICATORS AND A LIST OF 19 PRIORITY INDICATORS FOR MONITORING AGRICULTURE AND RURAL DEVELOPMENT INITIATIVES AT PROJECT, NATIONAL, REGIONAL GLOBAL LEVELS • DATA REQUIREMENT, SOURCES AND STATISTICAL CAPACITY :
LOGFRAME AND FREQUENCY OF MONITORING VARIOUS INDICATORS Medium to Long Run (maybe 5 years by the time surveys are carried out) Impact Indicators (Ultimate goal) Outcome Indicators (behavioral change) Medium Term - Ideally annually – maybe every 2 – 3 years Output Indicators (Goods and Services) Short – Medium Term - Ideally more than once a year or annually Input Indicators (Material, financial, human) Short Term - Ideally every three months or annually Outcome and impact: RESULT INDICATORS
SELECTION OF INDICATORS • What makes a Good Indicator • SSPECIFIC and SENSITIVE to the changes induced as a result of actions taken • MMEASURABLE progress can be shown and is not easily manipulated • AATTAINABLE and APPLICABLE to the policy action taken • RRELEVANT to the areas in question • TTIME BOUND and TRACKABLE by showing changes over time MAIN CRITERIA USED TO SELECT 19 PRIORITY INDICATORS: • RELEVANCE (FOR SUB SECTORS ONLY ONE WAS SELECTED) • COMPARABILITY • AVAILABILITY (BASED ON COUNTRY STUDIES AND VALIDATIONS)
MENU OF INDICATORS, DATA REQUIREMENTS, DATA SOURCES AND TECHNICAL NOTES INDICATORS, DATA REQUIREMENTS, DATA SOURCES (EXAMPLE 6 SECTOR WIDE INDICATORS)
MAIN DATA SOURCESSurveys vs. non-formal appraisal methods Direct measurement Household budget survey Fish landing Surveys Censuses Questionnaire (quantitative) Questionnaire (Qualitative) P.P.A CWIQ Sentinel site surveillance LSMS Structured interview Case study Purposive selection Quota sampling Small prob. sample Large prob. sample Census Beneficiary assessment Open meetings Participant observation Community Surveys Conversations Windscreen survey Subjective assessments
1. IMPORTANCE OF LINKING DATA USERS AND PRODUCERS FOR:- relevance- avoiding duplication FAO/WB STUDY FOUND THAT M&E AND STATISTICS SYSTEMS ARE DISCONNECTED IN MOST OF THE 5 PILOT COUNTRIES 2. CHALLENGES OF DECENTRALISATION AND CORRESPONDING DATA REQUIREMENT AND NEED FOR METHOGOLOGICAL RESPONSES (Small area estimation, better use of administrative data etc..)3. SELECTION OF INDICATORS: DOES THE STATISTICS SYSTEM HAS THE CAPACITY? NEED FOR INTEGRATED STATISTICAL PROGRAMME WITH CORRESPONDING STATISTICAL CAPACITY BUILDING COMPONENT4. NINETEEN PRIORITY INDICATORS OF FAO/WB SOURCEBOOK PROPOSED AS STARTING POINT FOR MENU OF INDICATORS IN GLOBAL STRATEGY CONCLUDING REMARKS