Strategic Market Analysis for Business Growth
510 likes | 611 Vues
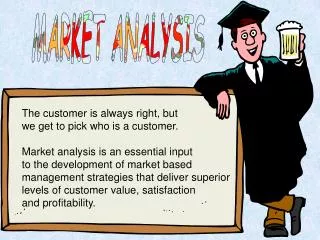
Understand market dynamics, dimensions, and customer preferences to inform investment decisions and brand strategies. Learn market relevance vs. preference, gaining strategies, and emerging submarkets creation. Explore market size analysis and special cases for market potential. Boost your business success!

Strategic Market Analysis for Business Growth
E N D
Presentation Transcript
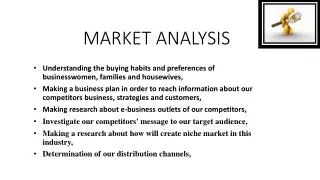
Purpose of Market Analysis To determine the attractiveness of a market ( or submarket) to current and potential participants. Market attractiveness, the firm’s profit potential as measured by the long –term ROI achieved by its participants, will provide important input into the product – market investment decision To understand the dynamics of a market
Dimensions of a Market Analysis • Emerging submarkets relevance • Actual and potential market and submarket size • Market and submarket growth • Market and submarket profitability • Cost structure • Distribution systems • Trends and developments • Key success factors
RELEVANCE VS PREFERENCE Relevance dominates. If a group of customers wants a battery powered car it does not matter how much they love your hybrid brand. It will not be relevant. A newspaper can have the best new coverage and editorial staff, but if readers are diverted to cable news or blogs, relevance will decline. The ultimate tragedy is to achieve brilliant differentiation, winning the preference battle, only to have that effort wasted as its relevance declines.
4 strategies to gain relevance • Gain parity. The goal is to create a close-enough option to a competitor's "must have”. ( eg Mc Donald’s Mc Café line with reasonable coffee quality to take on Starbucks threat to breakfast and off hours business) • Leapfrog the innovation. Instead of being satisfied with being relegated to having a parity product, a firm could attempt to take over the new category or subcategory or at least to become a significant player with a substantial or transformational innovation that leapfrogs the competitor. ( eg Nike, Adidas, Cisco Systems) • Reposition. Modify and reposition the brand so that its value proposition becomes more relevant given the market dynamics. ( Madonna, LL Bean from hunting fishing and camping to all outdoors)) • Stick to your knitting. Rather than adapting, keep pursuing the same strategy with the same value proposition but just do it better, keep improving, and create brand energy. ( Gilette vs Electric razors)
Customer Decision Process Brand Relevance Brand Preference Determine Brands to Consider Select Product Category or Subcategory Select Brand to Buy • SUV • Mercedes • Lexus GX, RX etc • BMW X1 • Mercedes • Benz GLK compact
Emerging submarket • The challenge is to detect and understand emerging submarkets, identify those that are attractive to the firm, given its assets and competencies, and then adjust offerings and brand portfolios in order to increase their relevance to the chosen submarkets.
Creation and Types of Sub markets A) Product or service can be augmented or expanded to include a new dimension. Eg cell phones with cameras B) Market can be broken into niches. Eg an Energy Bar fragmented into : • High Protein • For women • Low calories • Apple Crunch • Oats N Honey Each of these niches is an area for which the original Energy Bar was not relevant
C) Application scope can be expanded from components to systems or turnkey solutions ie.an aggregation into submarkets. Siebel in the 1990s created Internet based CRM solutions by aggregating a host of application areas including customer loyalty programmes, call centres ,sales force automation D) Emergence of a new and distinct application can define relevant brand options. ( Eg, Bayer 81 mg Baby Aspirin and later Enteric Safety Coating for minimizing adverse effects of regular aspirin usage on the stomach.)
E) A product class can be repositioned eg Starbucks repositioning the retail coffee market F) A customer trend can drive a submarket Eg, Wellness and Herbs etc has given rise to HRB ( Healthy Refreshment Beverages) G) New Technology – Notebook computers, I phones, hybrid cars can drive the perception of a submarket. Or In Japan Asahi Super Dry Beer was a new category of dry beer created to capture a large segment of Kirin the leading lager beer. H) A whole market can be invented eg e Bay creating an online auction.
Market Size • Actual market size is the starting point of the analysis of a market or submarket. • In addition to this the potential market needs to be considered. A new use, new user group, or more frequent usage could dramatically change the size and prospects for the market. However, potential must not only be recognized but the marketer must have the vision and strategy in place to exploit it.
Special cases • Ghost potential – Eg, Need for computers in many underdeveloped countries but low buying power and government regulations make it impossible for companies to operate in these markets. Many dotcom concepts also received huge hype but the applications failed to materialize. • Large companies such as Marriot, P& G have investment criteria which prohibit them from investing in smaller markets as the growth rate is low as compared to the company’s desired levels. This can be an opportunity missed and causes them to lose the first mover advantage should the market expand in size. It must be remembered that most markets were small to begin with and remained so for years.
Market and submarket growth It appears logical to identify and invest in growth situations and disinvest in decline situations. But declining products markets may cause competitors to exit and present a growth opportunity. The firm may attempt to become a profitable survivor by encouraging others to exit and by becoming dominant in the most viable segments. Conversely, growth contexts are not always attractive as they can involve substantial risk.
Driving Forces • The most strategic uncertainty involves prediction of market sales. A strategic investment decision will often depend on understanding the driving forces behind the market dynamics.
Forecasting growth • Historical data is useful but needs to be used with care. • What is more useful strategically is prediction of turning points , ie times when the rate and perhaps direction of growth change.
Some leading indicators of market sales may help in forecasting and predicting turning points eg • Demographic data : eg, the number of births is a leading indicator of the demand for education / the number of people reaching 58/60 is a leading indicator of the demand for retirement facilities.
Eg.Sales of related equipment : Personal computers and printers sales would provide a leading indicator of the demand for supplies and service needs. • Market sales forecasts, especially of new markets, can be based on the experience of analogous industries. This is done by identifying a prior market with similar characteristics .eg sales of CTV are likely to follow patterns similar to sales of B& W TV seen earlier. A new snack could study the history of granola bars or energy bars and make educated guesses. • If several analogous classes exist and can be examined and differences related to their characteristics, maximum benefit will be obtained.
Detecting Maturity and Decline • A particularly important turning point in market sales occurs when the growth phase of a product life cycle changes into a flat maturity phase and the maturity phase changes into a decline phase. • These transitions are important indicators of the health and nature of the market. Historical sales and profit patterns of a market can help to identify the onset of maturity or decline.
More sensitive Indicators for Detecting Maturity and Decline • Price pressure caused by overcapacity and the lack of product differentiation • Buyer sophistication and knowledge • Substitute products or technologies • Saturation • No growth sources • Customer disinterest
Questions to Help Structure a Market Analysis • Submarkets Are augmented products, emerging niches, trend toward systems, new applications, repositioned product classes, customer trends, or new technologies creating worthwhile submarkets? How should they be defined? • Size and Growth Potentially important submarkets? Size and growth characteristics? Submarkets declining? How fast? Driving forces behind the trends? Figure 4.1
Questions to Help Structure a Market Analysis • Profitability How intense is the competition among existing firms? Threats from potential entrants and substitute products? Bargaining power of suppliers and customers? Attractive/profitable markets or submarkets? • Cost Structure Major cost and value-added components for various types of competitors? Figure 4.1
Questions to Help Structure a Market Analysis • Distribution Systems Alternative channels of distribution? How are they changing? • Market Trends • Key Success Factors Key success factors, assets, and competencies to compete successfully? Can assets and competencies of competitors be neutralized? Figure 4.1
Market and submarket Profitability Analysis Harvard Economist Michaal Porter applied his theories and findings to the business strategy problem of evaluating the investment value of an industry or market. The problem is to identify how profitable the average firm will be.
Industry Profitability or Long term Attractiveness • Michael Porter has identified 5 forces that determine the intrinsic long run attractiveness or profitability of a market or market segment.
Competition among existing firms Porter’s Five-Factor Model ofMarket Profitability Threat of Potential Entrants Industry Profitability Threat of Substitute Products Bargaining Power of Suppliers Bargaining Power of Customers Figure 4.3 Source: Adapted from Michael E. Porter, “Industry Structure and Competitive Strategy: Keys to Profitability” Financial Analysis Journal,July-August 1980,p.33.
" The nature of competition in an industry is strongly affected by the suggested five forces. The stronger the power of buyers and suppliers, and the stronger the threats of entry and substitution, the more intense competition is likely to be within the industry. "
Threat of intense segment rivalry A segment is unattractive if • It contains many strong or aggressive competitors • Both entry and exit barriers are high. Worst case where entry barriers are low but exit barriers are high. • There are actual or potential substitutes for the product. • Buyers possess strong or growing bargaining power
A segment is unattractive if the company’s suppliers are able to raise prices or reduce quantity supplied.
Force 1: The Degree of Rivalry The intensity of rivalry, which is the most obvious of the five forces in an industry, helps determine the extent to which the value created by an industry will be dissipated through head-to-head competition. This force is most likely to be high in those industries where there is a threat of substitute products; and existing power of suppliers and buyers in the market.
Force 2: The Threat of Entry Both potential and existing competitors influence average industry profitability. The threat of new entrants is usually based on the market entry barriers.
Most common entry barriers Economies of scale: for example, benefits associated with bulk purchasing; Cost of entry: for example, investment into technology; Distribution channels: for example, ease of access for competitors not easily duplicated Existing Contracts and expertise. Product differentiation of competitors that protect them from new entrants
Force 3: The Threat of Substitutes • The threat that substitute products pose to an industry's profitability depends on the relative price-to-performance ratios of the different types of products or services to which customers can turn to satisfy the same basic need. • The threat of substitution is also affected by switching costs – that is, the costs in areas such as retraining, retooling and redesigning that are incurred when a customer switches to a different type of product or service.
Force 4: Buyer Power Buyer power is one of the two horizontal forces that influence the appropriation of the value created by an industry. This force is relatively high where there a few, large players in the market. It is present where there is a large number of undifferentiated, small suppliers, such as small farming businesses supplying large grocery companies Low cost of switching between suppliers, such as from one fleet supplier of trucks to another.
Force 5: Supplier Power • Supplier power is a mirror image of the buyer power. As a result, the analysis of supplier power typically focuses first on the relative size and concentration of suppliers relative to industry participants and second on the degree of differentiation in the inputs supplied. • The ability to charge customers different prices in line with differences in the value created for each of those buyers usually indicates that the market is characterized by high supplier power and at the same time by low buyer power
Bargaining power of suppliers exists in the following situations: Where the switching costs are high (eg.switching from one Internet provider to another); High power of brands (McDonalds, British Airways, Tesco) Possibility of forward integration of suppliers Fragmentation of customers (not in clusters) with a limited bargaining power (Gas/Petrol stations in remote places).
Porter Competitive Model Potential New Entrants • Foreign General Merchandisers or • Discounters • Established Retailer Shifting Strategy • to Discounting or Megastores Intra-Industry Rivalry SBU: Wal-Mart Rivals: Kmart, Target, Toys R Us, Specialty Stores Bargaining Power of Suppliers Bargaining Power of Buyers • U.S. Product Manufacturers • Foreign Manufacturers • Local Governments • Consumers • in Small Town U.S.A. • Consumers in Metropolitans • Areas in the U.S. • Canadian and Mexican • Consumers • Other Foreign Consumers Substitute Products and Services • Mail Order • Home Shopping Network • Electronic Shopping • Telemarketing • Buying Clubs • Door-to-door Sales Figure 3-2
Market Trends • It is crucial to distinguish between trends that will drive growth and reward those who have adopted differentiated strategies and • Fads that will only last long enough to attract investment that is subsequently underemployed or lost forever.
Trend vs. Fads a) Trends are likely to be driven by a solid force such as: Demographics, Values, Lifestyle, Technology Not by Pop culture, fashion, a trendy crowd or media b) How accessible is it in the mainstream? Not confined to a niche or requiring a major change in ingrained habits or priced too high or hard to use c) Is it broadly based ? Across categories/ industries ? Eg Eastern influences in food design, health care in the US.
FADS • Temporary collective fascinations' (such as hula-hoop, Rubik's cube) known in American sociology as 'fads', may be regarded as examples of a model of ephemeral culture. • They emanate from such social values as: progress, change, 'being hip'. The consensus which develops around these fads is usually short-lived and a current object of fascination is abandoned once it becomes 'boring'.
Planking • Planking or the lying down game is an activity consisting of lying face down in an unusual or incongruous location. The hands must touch the sides of the body and having a photograph of the participant taken and posted on the internet is an integral part of the game.[1] Players compete to find the most unusual and original location in which to play.[1] The term planking refers to mimicking a wooden plank. • Many participants of planking since 2011 have photographed the activity on unusual locations such as atop poles, roofs and vehicles, while some "plankers" engage in the activity by planking only their upper body and feet while leaving the back suspended.
PLANKING was so last week.New viral craze "teapotting" is now bidding to become the latest phenonmenon to dominate social media sites.A Facebook page for the "sporting" pursuit has already attracted dozens of pictures and nearly 2,000 fans.Marketed as a safer alternative to lying flat and motionless on your stomach with arms pinned to your side, teapotting lets enthusiasts keep their feet as they raise one arm to mimic a spout while the other forms a handle.
Owling • Move over Teapotting ……… • For those not in the know, " owling " is a brand new activity where people pose for pictures by crouching like an owl in unusual places, such as on top of a car, fountain or a staircase. In other words, Owling is the new Planking. • Is human kind really THAT bored?
Key Success factors • These are assets and competencies that provide the basis for competing successfully. • Strategic necessities and strategic strengths need to be identified and projected into the future mainly to identify emerging KSFs.
Risks in High Growth markets • Number and commitment of competitors may be too high for market to support • Competitor/s with superior product / lower price • Key Success Factors might change and the organization unable to adapt • Technology might change • Market growth lower than expectations • Price instability • Inadequate resources to maintain high growth rate • Inadequate distribution
Risks of High-Growth Market • Competitive Risk • Overcrowding • Superior competitive entry • Firm Limitations • Resource constraints • Distribution unavailable • Market Changes • Changing KSFs • New technology • Disappointing growth • Price instability Figure 4.5