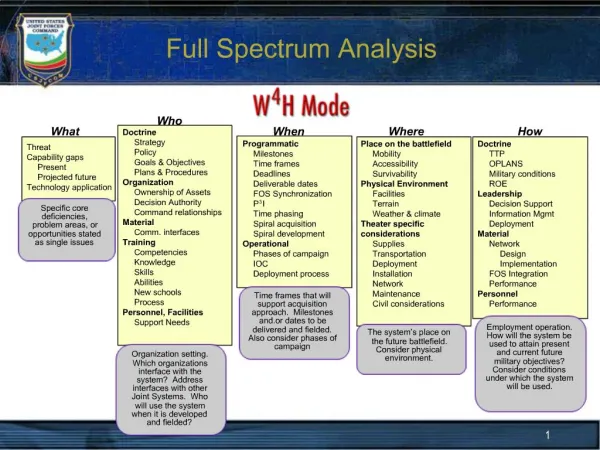
Dielectron Spectrum Analysis
This document outlines the action items derived from the recent dielectron spectrum analysis, focusing on high pt and mass falls due to isolation cuts. Key recommendations include shifting to relative isolation minimum values at low energy and waiting for the 3X move for further optimization. Found bugs in delta R matching are discussed, and there are tasks to examine eta plots and make necessary curves for mass regions. Additionally, look into efficiencies of selection steps and compare with previous definitions. Prioritize adding mother information to the ntuple for improved analysis.


Dielectron Spectrum Analysis
E N D
Presentation Transcript
Dielectron Spectrum Analysis J. Leonard 7 Oct. 2009
Today • Action items from e-mail • High pt and mass fall off caused by isolation cuts. Move to relative isolation with minimum value at low energy. Your previous cut values are probably a good value for the minimum value at low energy. • Wait until move to 3X for any optimization, after 2X note is done • Make delta R plot for events in barrel with pt<50GeV. With current definition of gen pt. For these events. Search for bug. Ignore rest if you find one • Found bug in R-matching • are these events radiating so strongly. Dont expect this to happen • plot gen level - gen level for different statuses. • plot reco level vs gen level before radiation • match to electrons that have the Z as a parent. • Still want to get mother information to understand invariant mass plot • Check the eta plot. • See later slides • New plots for two electrons Matt • For the second electrons in events above and below the Z peak what do the eta and pt distributions look like compared to in the peak. • Make curves for each region of mass you think is relevant. • Compare your denominator and numerator definitions for efficiency with Christos • Sasha Remake the barrel only plots with a cut of eta<1.0 • Push upsilon trigger note out separately
Total efficiency of each selection step • Fraction of gen-level electrons (selected previously) passing each step as function of selected electron’s gen-level pT • Barrel + endcap
Total efficiency of each selection step: barrel-only • Fraction of gen-level electrons (selected previously) passing each step as function of selected electron’s gen-level pT • Barrel only • Looks much better post-bugfix! No giant dip at low end
Total efficiency of each selection step • Fraction of gen-level electrons (selected previously) passing each step as function of selected electron’s gen-level • Barrel + endcap
Efficiencies of steps wrt. previous step: vs • Efficiencies of steps wrt. previous step • Both barrel and endcap shown
Comparing gen-level Z/* and electrons: Minv spectrum • Left plot non-log-scale, right plot log-scale • Further investigation: looked at dump of particles in ten events • Usually at least one electron radiates a photon as FSR • In 2/10 events, this caused an electron energy change of >~few GeV • Enough to cause this effect? Still don’t know, but to find out . . . • Add mother/status information to ntuple in order to look at electrons from Z
Next Steps • Add mother information to ntuple to select electrons from Z • Then see how efficiency/spectrum changes • Start putting together 22X analysis note with what I have • Highest priority! • Get template, add outline, plots