Download
1 / 26
280 likes | 560 Vues
Statistical Criteria for Establishing Bio-inequivalence among Drug Products . Qian H. Li, Lawrence Yu, Donald Schuirmann, Stella Machado, Yi Tsong CDER, FDA. Outline of the Presentation . Definition of bio-inequivalence Explanation on failing to show bioequivalence

E N D
Statistical Criteria for Establishing Bio-inequivalence among Drug Products Qian H. Li, Lawrence Yu, Donald Schuirmann, Stella Machado, Yi Tsong CDER, FDA
Outline of the Presentation • Definition of bio-inequivalence • Explanation on failing to show bioequivalence • Explanation on a proposed statistical criterion for assessing bio-inequivalence using one PK parameter • Strategies for evaluating bio-inequivalence using three PK parameters
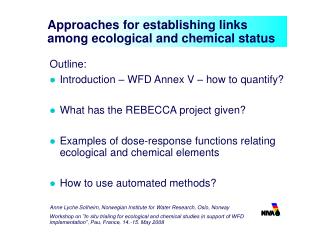
µT/µR 80% 125% Bio-inequivalence Region Bio-inequivalence Region Bioequivalence Interval Definitions • Definitions in terms of the ratio of the two geometric means µT/µR,where µT and µR are the geometric means of the test and reference products, respectively • Bioequivalence interval [80%, 125%] • Bio-inequivalence regions (0, 80%) or (125%,)
Failing to Show Bioequivalence • Is it appropriate to claim bio-inequivalence if a study fails to show bioequivalence? • Two drug products may be bioequivalent, however, they may fail to show bioequivalence due to • Inadequate power (primary reason); • Bias from inadequate statistical model.
Testing for Bioequivalence • Hypotheses of testing bioequivalence: H0: µT/µR < 80% or µT/µR >125% vs. HA: 80% µT/µR 125% • Perform two 1-sided tests • H01: µT/µR < 80% vs. HA1: µT/µR 80% • H02: µT/µR >125% vs. HA2: µT/µR 125% • Reject H0 if we reject both 1-sided null hypotheses, each at =0.05 • Equivalent to a 2-sided 90% CI falling within [80%, 125%] • The type I error of rejecting H0 is controlled at 0.05
Error Associated with Claiming HA • To claim HA (bioequivalence), need to reject H0 (bio-inequivalence) in a statistical test with high confidence. • A rejection criterion is selected so that the error of wrongfully rejecting H0 and therefore wrongfully claiming HA is small. • Type I error, usually set at a level of =0.05 (level of significance)
Error Associated with Claiming H0 if You Don’t Claim HA • To claim H0 (bio-inequivalence), need to reject HA (bioequivalence) with high confidence. • Need to control the error of wrongfully rejecting HA to be small, which is equivalent to requiring large power to reject H0 in the bioequivalence test. • However, the power of the bioequivalence test may not be large for all values of T/Rin HA. • Testing for bioequivalence focuses on controlling type I error for rejecting H0. • We may not have adequate power to claim bioequivalence when bioequivalence is true.
Example of Inadequate Power • For a regular 2-way crossover trial, assume that • Within-subject Variance (log scale) is 0.04 • The ratio of the two geometric means deviates from 1 by no more than 5% • Wish to achieve 85% power • Require a sample size of 22 • About 15% chance to see a failed bioequivalence study • If sample is kept at 22, power can be even lower • if Variance is higher • if the ratio deviates from 1 by more than 5%
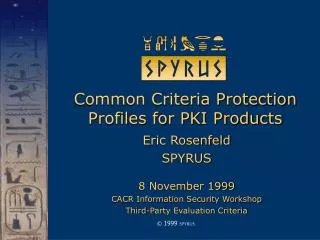
Rejection Region σt σt Power vs. Variance for Bioequivalence • Rejection region: reject bio-inequivalence and claim bioequivalence if the estimated ratio is in this region • The width of the rejection region reflects the power, which depends on the variance of the estimate of T/R.
Test for Bio-inequivalence • Hypotheses for testing bio-inequivalence: H0: 80% µT/µR 125% vs. HA: µT/µR < 80% or µT/µR >125% • Perform 2 one-sided tests • H01: µT/µR 80% vs. HA1: µT/µR < 80% • H02: µT/µR 125% vs. HA2: µT/µR >125% • The significance level for each one-sided test is controlled at 0.05 • Reject bioequivalence when two-sided 90% CI are completely in either of the two bio-inequivalence regions • Under certain conditions, the type I error under H0 is controlled at or near the level of 0.05. • However, mathematically, the type I error can reach up to 0.1.
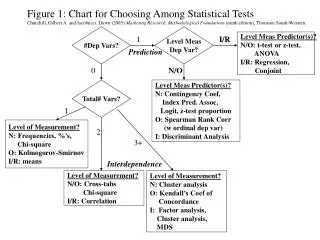
σt σt Power vs. Variance for Bio-inequivalence Test Rejection Region Rejection Region
Error Discussion for Bio-inequivalence Test • The Type-I error for the bioequivalence test is controlled at the 0.05 level. • To be consistent, bio-inequivalence should also be tested at 0.05 level. • The error rate for testing bio-inequivalence • Where = T/R, T is a test statistic that follows a t-distribution, and t is the critical point for the two one-sided tests.
Error Discussion • The error rate depends on the distribution of the test statistics under the null: the location in the bioequivalence interval and variance. • For a given T, the maximum error rate occurs at the margins of the bioequivalence interval. • The maximum error increases as T increases. When T , the maximum error rate could reach 0.10.
Error Discussion • For what kind of variance does the error rate start to inflate noticeably above 0.05? • Error calculations: • Assume 2-way balanced crossover trials • Using t distribution • Error is calculated at the margins • Standard error represents T, the standard deviation for the estimated treatment difference (log scale) • Standard deviation (S.D.) represents intra-subject variability between two drug products.
Error Discussion • For sample size n≥10, the type I error can be controlled around the level of 0.05 if the standard error (s.e.) is 0.226. • For a balanced 2-way crossover trial, such variance is considered quite large (s.d. ≥0.505) • If bio-inequivalence study with sample size less than 10, it is possible that the type I error will be inflated with small s.e. • If a trial uses a parallel design, s.e. may be high enough to require adjusting the significance level.
Evaluating Three PK Endpoints • Three PK parameters (AUCt, AUC∞, Cmax) used to assess bioequivalence. • Bioequivalence of two drugs requires that all the three PK parameters should be equivalent in terms of the bioequivalence interval using ratios µT/µR. • Bio-inequivalence holds if one of the three PK parameters is in the bio-inequivalence regions.
Three PK Endpoints for Bioequivalence • The statistical criteria we use to demonstrate bioequivalence for the three PK parameters are to have all the 2-sided 90% CIs for the ratios to be within [80%, 125%]. • What are the statistical criteria for bio-inequivalence?
Assessing Bio-inequivalence with Three PK Endpoints • Evaluate several strategies based on composite hypotheses: H0_ineq: H10 H20 H30 vs. HA_ineq: H1A H2A H3A • Hi0 are the equivalence intervals • HiA are the inequivalence regions For i=1,2,3 (the three PK endpoints.) • Evaluate type I error and power under the composite hypotheses
Assessing Bio-inequivalence with Three PK Endpoints • Strategy I: At least one of the three PK parameters satisfies the bio-inequivalence criterion. • Pros: intuitive • Cons: May inflate type I error under H0_ineqif the three PK endpoints are not highly correlated (>0.99)
Assessing Bio-inequivalence with Three PK Endpoints • Strategy II: All three PK parameters must satisfy the bio-inequivalence criterion. • Pros: Can tightly control the type I error under all correlation structures for the three PK endpoints. • Cons: Usually does not provide adequate power for the alternatives that are of interest.
Assessing Bio-inequivalence with Three PK Endpoints • Strategy III: pre-specify one PK endpoint for bio-inequivalence testing. • For example, test AUCt only, ignore the other two. • Pros: Controls type I error. • Cons: may have very low power if AUCt is not the endpoint that is actually bio-inequivalent. Need a mechanism for pre-specification.
Assessing Bio-inequivalence with Three PK Endpoints • Other Strategies 1. - Require inequivalence to be shown for all three PK endpoints, but adjust the levels for the individual tests while maintaining the overall level. - the levels for the individual tests may differ, and may be determined in a flexible manner. - Currently under development in QMR. 2. Other?
Remarks • Main focus of this presentation is power and error • Other statistical issues such as inadequate statistical models, study design, and conduct of the study may also bring in bias in bioequivalence and bio-inequivalence assessment.