Download
1 / 50
500 likes | 580 Vues
Join SBS200, COMM200, GEOG200, PA200, POL200, or SOC200 Lecture Section 001 in Room 120 ILC for an engaging session on probability and statistical concepts. Enhance your understanding with practical examples and exercises.

E N D
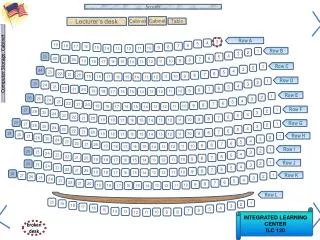
Screen Cabinet Cabinet Lecturer’s desk Table Computer Storage Cabinet Row A 3 4 5 19 6 18 7 17 16 8 15 9 10 11 14 13 12 Row B 1 2 3 4 23 5 6 22 21 7 20 8 9 10 19 11 18 16 15 13 12 17 14 Row C 1 2 3 24 4 23 5 6 22 21 7 20 8 9 10 19 11 18 16 15 13 12 17 14 Row D 1 2 25 3 24 4 23 5 6 22 21 7 20 8 9 10 19 11 18 16 15 13 12 17 14 Row E 1 26 2 25 3 24 4 23 5 6 22 21 7 20 8 9 10 19 11 18 16 15 13 12 17 14 Row F 27 1 26 2 25 3 24 4 23 5 6 22 21 7 20 8 9 10 19 11 18 16 15 13 12 17 14 28 Row G 27 1 26 2 25 3 24 4 23 5 6 22 21 7 20 8 9 29 10 19 11 18 16 15 13 12 17 14 28 Row H 27 1 26 2 25 3 24 4 23 5 6 22 21 7 20 8 9 10 19 11 18 16 15 13 12 17 14 Row I 1 26 2 25 3 24 4 23 5 6 22 21 7 20 8 9 10 19 11 18 16 15 13 12 17 14 1 Row J 26 2 25 3 24 4 23 5 6 22 21 7 20 8 9 10 19 11 18 16 15 13 12 17 14 28 27 1 Row K 26 2 25 3 24 4 23 5 6 22 21 7 20 8 9 10 19 11 18 16 15 13 12 17 14 Row L 20 1 19 2 18 3 17 4 16 5 15 6 7 14 13 INTEGRATED LEARNING CENTER ILC 120 9 8 10 12 11 broken desk
Introduction to Statistics for the Social SciencesSBS200, COMM200, GEOG200, PA200, POL200, or SOC200Lecture Section 001, Fall, 2014Room 120 Integrated Learning Center (ILC)10:00 - 10:50 Mondays, Wednesdays & Fridays. Welcome http://www.youtube.com/watch?v=oSQJP40PcGI
A noteon doodling Reminder
Lab sessions Labs continue this week
Schedule of readings • Before next exam (October 17th) • Study guide is available online • Please read chapters 5, 6, & 8 in Ha & Ha • Please read Chapters 10, 11, 12 and 14 in Plous • Chapter 10: The Representativeness Heuristic • Chapter 11: The Availability Heuristic • Chapter 12: Probability and Risk • Chapter 14: The Perception of Randomness
Use this as your study guide By the end of lecture today10/10/14 Counting ‘standard deviationses’ – z scores Connecting raw scores, z scores and probabilityConnecting probability, proportion and area of curve Percentiles
Homework due – Monday (October 13th) On class website: Please print and complete homework worksheet #12 Approaches to probabilities and Interpreting probabilities using the normal curve
What is probability 1. Empirical probability: relative frequency approach Number of observed outcomes Number of observations Probability of getting into an educational program Number of people they let in 400 66% chance of getting admitted Number of applicants 600 Probability of getting a rotten apple 5% chance of getting a rotten apple Number of rotten apples 5 Number of apples 100
What is probability 1. Empirical probability: relative frequency approach “There is a 20% chance that a new stock offered in an initial public offering (IPO) will reach or exceed its target price on the first day.” “More than 30% of the results from major search engines for the keyword phrase “ring tone” are fake pages created by spammers.” 10% of people who buy a house with no pool build one. What is the likelihood that Bob will? Number of observed outcomes Number of observations Probability of hitting the corvette Number of carts that hit corvette Number of carts rolled 182 = .91 200 91% chance of hitting a corvette
2. Classic probability: a priori probabilities based on logic rather than on data or experience. All options are equally likely (deductive rather than inductive). Likelihood get question right on multiple choice test Chosen at random to be team captain Lottery Number of outcomes of specific event Number of all possible events In throwing a die what is the probability of getting a “2” Number of sides with a 2 1 16% chance of getting a two = Number of sides 6 In tossing a coin what is probability of getting a tail 1 Number of sides with a 1 50% chance of getting a tail = 2 Number of sides
3. Subjective probability: based on someone’s personal judgment (often an expert), and often used when empirical and classic approaches are not available. 60% chance that Patriots will play at Super Bowl Likelihood that company will invent new type of battery Likelihood get a ”B” in the class There is a 5% chance that Verizon will merge with Sprint Bob says he is 90% sure he could swim across the river
Approach Example Empirical There is a 2 percent chance of twins in a randomly-chosen birth Classical There is a 50 % probability of heads on a coin flip. Subjective There is a 5% chance that Verizon will merge with Sprint
If P(A) = 0, then the event cannot occur. If P(A) = 1, then the event is certain to occur. The probability of an event is the relative likelihood that the event will occur. The probability of event A [denoted P(A)], must lie within the interval from 0 to 1: 0 <P(A) < 1
Probability The probabilities of all simple events must sum to 1 P(S) = P(E1) + P(E2) + … + P(En) = 1 For example, if the following number of purchases were made by
What is the complement of the probability of an event • The probability of event A = P(A). • The probability of the complement of the event A’ = P(A’) • A’ is called “A prime” • Complement of A just means probability of “not A” • P(A) + P(A’) = 100% • P(A) = 100% - P(A’) • P(A’) = 100% - P(A) Probability of getting a rotten apple 5% chance of “rotten apple” 95% chance of “not rotten apple” 100% chance of rotten or not Probability of getting into an educational program 66% chance of “admitted” 34% chance of “not admitted” 100% chance of admitted or not
Two mutually exclusive characteristics: if the occurrence of any one of them automatically implies the non-occurrence of the remaining characteristic Two events are mutually exclusive if they cannot occur at the same time (i.e. they have no outcomes in common). Two propositions that logically cannot both be true. NoWarranty Warranty For example, a car repair is either covered by the warranty (A) or not (B). http://www.thedailyshow.com/video/index.jhtml?videoId=188474&title=an-arab-family-man
Collectively Exhaustive Events Events are collectively exhaustive if their union isthe entire sample space S. Two mutually exclusive, collectively exhaustive events are dichotomous (or binary) events. For example, a car repair is either covered by the warranty (A) or not (B). NoWarranty Warranty
NoWarranty Satirical take on being “mutually exclusive” Warranty Recently a public figure in the heat of the moment inadvertently made a statement that reflected extreme stereotyping that many would find highly offensive. It is within this context that comical satirists have used the concept of being “mutually exclusive” to have fun with the statement. Decent , family man Arab Transcript: Speaker 1: “He’s an Arab” Speaker 2: “No ma’am, no ma’am. He’s a decent, family man, citizen…” http://www.thedailyshow.com/video/index.jhtml?videoId=188474&title=an-arab-family-man
Union versus Intersection ∩ P(A B) Union of two events means Event A or Event B will happen Intersection of two events means Event A and Event B will happen Also called a “joint probability” P(A ∩ B)
The union of two events: all outcomes in the sample space S that are contained either in event Aor in event Bor both (denoted A B or “A or B”). may be read as “or” since one or the other or both events may occur.
The union of two events: all outcomes contained either in event Aor in event Bor both (denoted A B or “A or B”). What is probability of drawing a red card or a queen? what is Q R? It is the possibility of drawing either a queen (4 ways) or a red card (26 ways) or both (2 ways).
Probability of picking a Queen Probability of picking a Red 26/52 4/52 P(Q) = 4/52(4 queens in a deck) 2/52 P(R) = 26/52 (26 red cards in a deck) P(Q R) = 2/52 (2 red queens in a deck) Probability of picking both R and Q When you add the P(A) and P(B) together, you count the P(A and B) twice. So, you have to subtract P(A B) to avoid over-stating the probability. P(Q R) = P(Q) + P(R) – P(Q R) = 4/52 + 26/52 – 2/52 = 28/52 = .5385 or 53.85%
Union versus Intersection ∩ P(A B) Union of two events means Event A or Event B will happen Intersection of two events means Event A and Event B will happen Also called a “joint probability” P(A ∩ B)
The intersection of two events: all outcomes contained in both event A and event B(denoted A B or “A and B”) What is probability of drawing red queen? what is Q R? It is the possibility of drawing both a queen and a red card (2 ways).
If two events are mutually exclusive (or disjoint) their intersection is a null set (and we can use the “Special Law of Addition”) P(A ∩ B) = 0 Intersection of two events means Event A and Event B will happen Examples: mutually exclusive If A = Poodles If B = Labradors Poodles and Labs:Mutually Exclusive (assuming purebred)
If two events are mutually exclusive (or disjoint) their intersection is a null set (and we can use the “Special Law of Addition”) P(A ∩ B) = 0 ∩ Dog Pound P(A B) = P(A) +P(B) Intersection of two events means Event A and Event B will happen Examples: If A = Poodles If B = Labradors (let’s say 10% of dogs are poodles) (let’s say 15% of dogs are labs) What’s the probability of picking a poodle or a lab at random from pound? P(poodle or lab) = P(poodle) + P(lab) P(poodle or lab) = (.10) + (.15) = (.25) Poodles and Labs:Mutually Exclusive (assuming purebred)
Normal distribution Raw scores z-scores probabilities Z Scores Have z Find raw score Have z Find area z table Formula Have area Find z Area & Probability Raw Scores Have raw score Find z
. Find score associated with the 75th percentile 75th percentile Go to table nearest z = .67 .2500 x = mean + z σ = 30 + (.67)(2) = 31.34 .7500 .25 .5000 24 36 ? 28 34 26 30 31.34 z = .67
. Find the score associated with the 25th percentile 25th percentile Go to table nearest z = -.67 .2500 x = mean + z σ = 30 + (-.67)(2) = 28.66 .2500 .25 .25 28.66 24 ? 36 28 34 26 30 z = -.67
Variability and means Variability and means 38 40 44 48 52 56 58 The variability is different…. The mean is the same … What might the standard deviation be? 38 40 44 48 52 56 58 Remember to keep number lines same for both examples
Variability and means Grades of all students in the class • 65 70 75 80 85 90 • Grades Grades of “C” students What might the standard deviation be? What might this be an example of? • 65 70 75 80 85 90 • Grades Other examples?
Variability and means Remember, there is an implied axis measuring frequency f 60 65 70 75 80 85 90 f Remember to keep number lines equally spaced 60 65 70 75 80 85 90 Remember to keep number lines same for both examples Variable must be numeric
Variability and means Birth weight for infants From entire population 1 3 5 7 9 11 13 Birth weight in pounds Birth weight for infants from a “typical family” What might the standard deviation be? What might this be an example of? • 3 5 7 9 11 13 • Birth weight in pounds Other examples? Notice: number lines equally spaced
Variability and means Social distance norm(personal space) for international community 40 50 60 70 80 90 100Social Distance Norm Social distance norm (personal space) for Tucson What might the standard deviation be? What might this be an example of? 40 50 60 70 80 90 100 Social Distance Norm Other examples? Notice: number lines equally spaced
Variability and means Distributions same mean different variability Final exam scores “C” students versus whole class Birth weight within a typical family versus within the whole community Running speed 30 year olds vs. 20 – 40 year olds Number of violent crimes Milwaukee vs. whole Midwest Social distance (personal space) California vs international community
Variability and means Distributions different mean same variability Performance on a final exam Before versus after taking the class 40 50 60 70 80 90 100 Score on final (before taking class) 40 50 60 70 80 90 100 Score on final (before taking class) Notice: number lines equally spaced
Variability and means Distributions different mean same variability Height of men versus women 62 64 66 68 70 72 74 76Inches in height (women) 62 64 66 68 70 72 74 76Inches in height (men) Notice: number lines equally spaced
Variability and means Distributions different mean same variability Driving ability Talking on a cell phone or not 2 4 6 8 10 12 14 16Number of errors (not on phone) 2 4 6 8 10 12 14 16Number of errors (on phone) Notice: number lines equally spaced
Variability and means Comparing distributions different mean same variability Performance on a final exam Before versus after taking the class Height of men versus women Driving ability Talking on a cell phone or not Notice: number lines equally spaced
. Writing Assignment Comparing distributions (mean and variability) • Think of examples for these three situations • same mean but different variability • same variability but different means • same mean and same variability (different groups) • estimate standard deviation • calculate variance • for each curve find the raw score for the z’s given Remember: number lines equally spaced
Homework review 2 = .40 5 Based on apriori probability – all options equally likely – not based on previous experience or data Based on expert opinion - don’t have previous data for these two companies merging together Based on frequency data (Percent of rockets that successfully launched)
Homework review Based on apriori probability – all options equally likely – not based on previous experience or data 30 = .30 100 Based on frequency data (Percent of times at bat that successfully resulted in hits) Based on frequency data (Percent of times that pages that are “fake”)
Homework review Based on frequency data (Percent of students who successfully chose to be Economics majors) 5 = .10 50
. .8276 .1056 .2029 .1915 .3944 .4332 .3944 .3944 55 55 55 52 44 50 50 44 - 50 4 52 - 50 4 -1.5 +.5 = = 55 - 50 4 +1.25 = z of 1.5 = area of .4332 z of .5 = area of .1915 1.25 = area of .3944 55 - 50 4 55 - 50 4 +1.25 +1.25 = = .5000 - .3944 = .1056 z of 1.25 = area of .3944 z of 1.25 = area of .3944 .4332 +.3944 = .8276 .3944 -.1915 = .2029
.3264 Homework review .2152 .5143 .1255 .3888 .1736 .1736 .3888 3,000 3,500 2,500 3,500 3,000 2500 - 2708 650 3000 - 2708 650 3000 - 2708 650 -.32 = 0.45 0.45 = = z of -0.32 = area of .1255 z of 0.45 = area of .1736 z of 0.45 = area of .1736 3500 - 2708 650 3500 - 2708 650 1.22 = 1.22 = .5000 - .1736 = .3264 z of 1.22 = area of .3888 z of 1.22 = area of .3888 .3888 +.1255= .5143 .3888 - .1736 = .2152
.0764 Homework review .9236 .1185 .4236 .4236 .4236 .3051 10 12 20 20 10 - 15 3.5 -1.43 = 20 - 15 3.5 20 - 15 3.5 1.43 1.43 = = z of -1.43 = area of .4236 z of 1.43 = area of .4236 z of 1.43 = area of .4236 12 - 15 3.5 -0.86 = .5000 + .4236 = .9236 .5000 - .4236 = .0764 z of -.86 = area of .3051 .4236 – .3051 = .1185
. Writing AssignmentComparing distributions (mean and variability) • Think of examples for these three situations • same mean but different variability • same variability but different means • same mean and same variability (different groups) • estimate standard deviation • calculate variance • for each curve find the raw score for the z’s given
Thank you! See you next time!!