
Influence of Drug Administration Time and Analytical Method on Tacrolimus Pharmacokinetics
This study investigates the influence of drug administration time and analytical method on tacrolimus pharmacokinetics using a population pharmacokinetic approach. Genetic factors and method variability were analyzed. Results show agreement between methods, with notable influences on drug absorption and clearance.

Influence of Drug Administration Time and Analytical Method on Tacrolimus Pharmacokinetics
E N D
Presentation Transcript
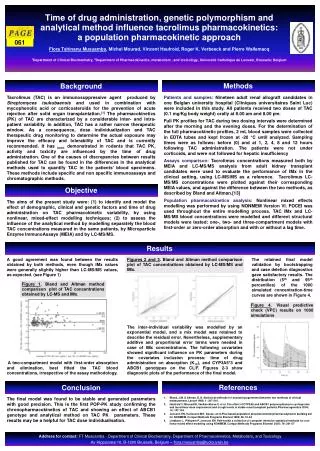
Time of drug administration, genetic polymorphism and analytical method influence tacrolimus pharmacokinetics:a population pharmacokinetic approachFlora Tshinanu Musuamba, Michel Mourad, Vincent Haufroid, Roger K. Verbeeck and Pierre Wallemacq1Department of Clinical Biochemistry, 2Department of Pharmacokinetics, metabolism , and toxicology, Université Catholique de Louvain, Brussels; Belgium 061 Methods Background Tacrolimus (TAC) is an immunosuppressive agent produced by Streptomyces tsukubaensis and used in combination with mycophenolic acid or corticosteroids for the prevention of acute rejection after solid organ transplantation.[1] The pharmacokinetics (PK) of TAC are characterized by a considerable inter- and intra-patient variability. In addition, TAC has a rather narrow therapeutic window. As a consequence, dose individualization and TAC therapeutic drug monitoring to determine the actual exposure may improve the efficacy and tolerability of TAC and is currently recommended. It has been demonstrated in rodents that TAC PK, activity and toxicity are influenced by the time of drug administration. One of the causes of discrepancies between results published for TAC can be found in the differences in the analytical methods used to quantify TAC in the patients’ blood specimens. These methods include specific and non specific immunoassays and chromatographic methods. Patients and samples: Nineteen adult renal allograft candidates in one Belgian university hospital (Cliniques universitaires Saint Luc) were included in this study. All patients received two doses of TAC (0.1 mg/Kg body weight) orally at 8.00 am and 8.00 pm. Full PK profiles for TAC during two dosing intervals were determined after the morning and the evening doses. For the determination of the full pharmacokinetic profiles, 2 mL blood samples were collected in EDTA tubes and kept frozen at -20 °C until analyzed. Sampling times were as follows: before (0) and at 1, 2, 4, 8 and 12 hours following TAC administration. The patients were not under corticoids, and were not followed for hepatic insufficiency Assays comparison: Tacrolimus concentrations measured both by MEIA and LC-MS/MS analysis from adult kidney transplant candidates were used to evaluate the performance of IMx in the clinical setting, using LC-MS/MS as a reference. Tacrolimus LC-MS/MS concentrations were plotted against their corresponding MEIA values, and against the difference between the two methods, as described by Bland and Altman.[13] Population pharmacokinetics analysis:Nonlinear mixed effects modelling was performed by using NONMEM Version VI. FOCEI was used throughout the entire modelling process. TAC IMx and LC-MS/MS blood concentrations were modelled and different structural models were tested: one-, two- and three-compartment models with first-order or zero-order absorption and with or without a lag time. Objective The aims of the present study were: (1) to identify and model the effect of demographic, clinical and genetic factors and time of drug administration on TAC pharmacokinetic variability, by using nonlinear, mixed-effect modelling techniques; (2) to assess the influence of the analytical method by modelling separately the blood TAC concentrations measured in the same patients, by Microparticle Enzyme ImmunoAssays (MEIA) and by LC-MS/MS. Results Figures 2 and 3. Bland and Altman method comparison plot of TAC concentrations obtained by LC-MS/MS and IMx. The retained final model validation by bootstrapping and case deletion diagnostics gave satisfactory results. The distribution (5th and 95th percentiles) of the 1000 simulated concentration-time curves are shown in Figure 4. A good agreement was found between the results obtained by both methods, even though IMx values were generally slightly higher than LC-MS/MS values, as expected. (see Figure 1) Figure 1. Bland and Altman method comparison plot of TAC concentrations obtained by LC-MS and IMx. Figure 4. Visual predictive check (VPC) results on 1000 simulations The inter-individual variability was modelled by an exponential model, and a mix model was retained to describe the residual error. Nevertheless, supplementary additive and proportional error terms were needed in case of IMx concentrations. The following covariates showed significant influence on PK parameters during the covariates inclusion process: time of drug administration on absorption (K12), and CYP3A5*3 and ABCB1 genotypes on the CL/F. Figures 2-3 show diagnostic plots of the performance of the final model. A two-compartment model with first-order absorption and elimination, best fitted the TAC blood concentrations, irrespective of the assay methodology. References Conclusion • Bland, J.M. & Altman, D.G. Statistical methods for assessing agreement between two methods of clinical measurement. Lancet 1986; 1: 307-310. • Haufroid V, Mourad M, VanKerckhove V, et al. The effect of CYP3A5 and ABCB1 polymorphismson cyclosporine and tacrolimus dose requirement and trough levels in stable renal transplant patients.Pharmacogenetics 2004; 14: 147-154 • Jonsson EN, Karlsoson MO, Xpose: an S-Plus based population pharmacokinetic/pharmacodynamic building aid for NONMEM. Comput Methods Programs Biomed 1999; 48, 51-64 • Lindbom L, Pihlgrem P, Jonsson EN. PsN-toolkit a collection of computer intensive statistical methods for non-linear mixed effect modeling using NONMEM. Comput Methods Programs Biomed 2005; 79: 241-57 The final model was found to be stable and generated parameters with good precision. This is the first POP-PK study confirming the chronopharmacokinetics of TAC and showing an effect of ABCB1 genotype and analytical method on TAC PK parameters. These results may be a helpful for TAC dose individualisation. Address for contact: FT Musuamba - Department of Clinical Biochemistry, Department of Pharmacokinetics, Metabolism, and Toxicology Av Hippocrate 10, B-1200 Brussels, Belgium – flora.musuamba@uclouvain.be


