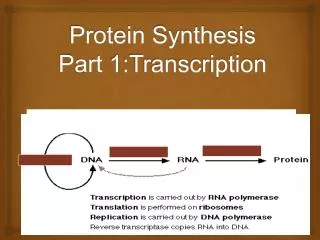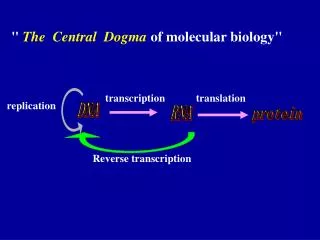
Transcription Part 2
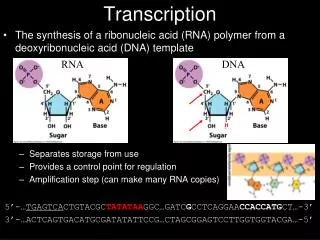
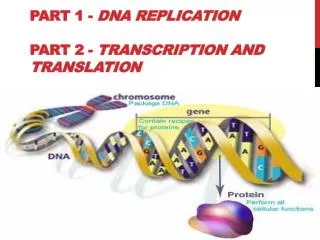
Transcription Part 2. Hexons and pentons form capsid. (TP) Covalently linked to DNA. 36 kbp. 50 nm. Transcribed by RNA pol II. Transcribed by RNA pol III. Figure A-1 Adenovirus.

Transcription Part 2
E N D
Presentation Transcript
Transcription Part 2
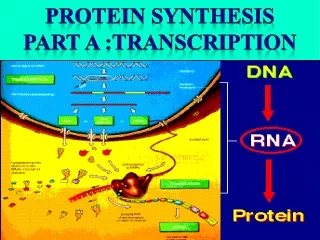
Hexons and pentons form capsid (TP) Covalently linked to DNA 36 kbp 50 nm Transcribed by RNA pol II Transcribed by RNA pol III Figure A-1 Adenovirus
Fig. 1. Recent examples of the various levels of regulation of eukaryotic gene expression and cell biology by ncRNAs. dsRNA, double-stranded RNA; HMT, histone methyltransferases; HP1, heterochromatin protein 1; PARs, promoter-associated RNAs; PcG, Polycomb group proteins; RISC, RNA-induced silencing complex; RITS, RNA-induced initiation of transcriptional gene silencing; siRNA, small interfering RNA; TFIIB, transcription factor IIB; and UCE, ultraconserved element P. P. Amaral et al., Science 319, 1787 -1789 (2008) Published by AAAS
Actually, lots of DNA codes for RNA on both strands • Interesting evidence: • Numbers of protein-coding genes do not change across metazoa as a whole!!!!!!!!!! • C. elegans: 1000 cells, 20,000 protein-coding genes • Human: 100 trillion cells, 25,000 protein-coding genes • Regulatory genes scale quadratically with genome size • Almost the entire genome of all eukaryotes is transcribed in one context or another • Most loci are marked by the presence of transcripts with sense or antisense overlaps, intronic RNAs and bidirectional transcription!!!!!! • More than 70% of known transcripts have evidence of overlap with RNA in the opposite orientation in mouse including 87% of the protein coding genes!!!!! These are lifted from Amaral and Mattick http://www.springerlink.com/content/t25m385772v56u4w/fulltext.pdf
Figure 31-12a The sequence of a fork-junction promoter DNA fragment. Numbers are relative to the transcription start site, +1. Page 1225
Figure 31-10 The sense (nontemplate) strand sequences of selected E. coli promoters. Page 1223
Figure 8.1 Pol II promoter Figure 8.4 Pol II promoter architecture
RNA polymerase • http://www.pingrysmartteam.com/RPo/RPo.htm
Figure 31-22 The proposed transcription cycle and translocation mechanism of RNAP. (a) Nucleotide addition cycle. (b) RNA · DNA complex in RNAP II. Page 1235
Figure 31-21bX-Ray structure of an RNAP II elongation complex. Page 1234
Fig. 2 Structure of pol II elongation complex in the backtracked state Structure of pol II elongation complex in the backtracked state. (A) Complex with one mismatched residue at the 3'-end of the RNA (12-nt oligomer RNA). The view is a standard one, from the "Rpb2 side," as in the past (22–25). Difference electron density map (Fobs – Fcalc omit map, contoured at 3.0 sigma) D. Wang et al., Science 324, 1203 -1206 (2009) Published by AAAS
Three states of a transcribing complex a pretranslocation state, in which the nucleotide just added to the growing RNA chain is still in the nucleotide addition site a posttranslocation state, in which the enzyme has moved forward on the template, which makes the nucleotide addition site available for entry of the next nucleoside triphosphate (NTP) a backtracked state, in which the enzyme has retreated on the template, extruding the 3'-end of the RNA Forward movement favored by NTP binding traps the complex in the posttranslocation state. Backtracking predominates when forward movement is impeded damage in the template or by nucleotide misincorporation in the RNA Backtracking by one or a few residues is reversible backtracking a greater distance leads to arrest, recovery is only possible by cleavage of the transcript in the polymerase active center, transcription factor SII (TFIIS) in eukaryotes and GreA and/or Gre B in bacteria Backtracking and cleavage enable proofreading of the transcript, through the excision of misincorporated nucleotides and resynthesis • RNA pol oscillates between forward and backward movement at every step in the process
Fluorescence resonance energy transfer(FRET) • Example of FRET between CFP and YFP (Wavelength vs. Absorption): a fusion protein containing CFP and YFP excited at 440nm wavelength. The fluorescent emission peak of CFP overlaps the excitation peak of YFP. Because the two proteins are adjacent to each other, the energy transfer is significant–a large proportion of the energy from CFP is transferred to YFP and creates a much larger YFP emission peak.
Transcription • RNAP bind to promoter →closed complex • unwinds 14 bp DNA → open complex • Upstream boundary protected by footprinting is unchanged but the open complex can synthesize 9-11 nt RNA • HUH? 3 models
Fig. 1. Background and experimental approach. (A) Background. Three models have been proposed for RNAP active-center translocation during initial transcription [(4–8); see also (9–15)]: transient excursions, inchworming, and scrunching. White circles, RNAP active center; red dashed lines, RNA; black rectangles: promoter –10 and –35 elements. (B) Experimental approach. (Top) Use of confocal microscopy with ALEX (19–21) to monitor fluorescence of single transcription complexes. Single transcription complexes labeled with a fluorescent donor (D, green) and a fluorescent acceptor (A, red) diffuse through a femtoliter-scale observation volume (green oval; transit time 1 ms); each molecule is illuminated with light that rapidly alternates between a wavelength that excites the donor and a wavelength that excites the acceptor. For each single molecule, and for each excitation wavelength, fluorescence emission is detected at both donor and acceptor emission wavelengths. This configuration permits calculation of two parameters: the donor-acceptor stoichiometry parameter, S, and the observed efficiency of the donor-acceptor energy transfer, E* (19–21). The parameter S permits identification of molecules containing both donor and acceptor (S = 0.4 to 0.9; desired species; boxed in blue), molecules containing only a donor (S > 0.9; undesired species, arising from the presence of free 70 molecules and buffer impurities), and molecules containing only an acceptor (S < 0.4; undesired species, arising from the dissociation of nonspecific complexes after heparin challenge). Subsequent analysis is performed only on molecules containing both donor and acceptor. (Bottom) Nucleoside triphosphate (NTP) subsets and corresponding RNA products and complexes. A. N. Kapanidis et al., Science 314, 1144 -1147 (2006) Published by AAAS
3 Models • 1. Transient excursions: multiple cycles of forward and backward movement • 2. Inchworming: a flexible element in RNAP translocates downstream and retracts upon abortive RNA production • 3. SCRUNCHING: flexible element in DNA—RNAP pulls downstream DNA into itslf and DNA accumulates as a ss bulge within the unwound region
Fig. 2. Initial transcription does not involve transient excursions Panels display negative results. For POSITIVE results, see next slide. A. N. Kapanidis et al., Science 314, 1144 -1147 (2006) Published by AAAS
Fig. 4. Initial transcription involves scrunching Fig. 4. Initial transcription involves scrunching. (A) Experiment documenting contraction of DNA between positions –15 and +15 [Cy3B as donor at DNA position –15; Alexa647 as acceptor at DNA position +15]. Subpanels as in Fig. 2A. [The two donor-acceptor species in the E* histograms comprise free DNA (lower-E* species) and RPo or RPitc, 7 (higher-E* species; higher FRET attributable to RNAP-induced DNA bending)]. Free DNA is present in all experiments, arising from dissociation of nonspecific complexes after heparin challenge during preparation ofRPo, but is detected only in this experiment, because DNA contains both donor and acceptor only in this experiment. (B) Summary of results. Structural model of RPo (28) showing all donor-acceptor distances monitored in this work (Figs. 2 to 4A and figs. S2 to S8). Distances that remain unchanged on transition from RPo to RPitc, 7 are indicated with thin blue lines. Distances that decrease on transition from RPo to RPitc, 7 are indicated with thick blue lines. The red and pink arrows show the proposed positions at which scrunched templatestrand DNA and scrunched nontemplate-strand DNA, respectively, emerge from RNAP (i.e., near template-strand positions –9 to –10 and near nontemplate-strand positions –5 to –6). A. N. Kapanidis et al., Science 314, 1144 -1147 (2006) Published by AAAS
Generalized scheme for the events occurring during initiation of transcription • The core promoter is shown in blue and the transcription initiation site is indicated by a green dot. After RNA polymerase attachment, the closed complex is converted into the open complex by breakage of base pairs within a short region of the DNA double helix. RNA synthesis begins but successful initiation is not achieved until the polymerase moves away from the promoter region.
Figure 31-15 RNA chain elongation by RNA polymerase. Page 1227
Figure 31-16 An electron micrograph of three contiguous ribosomal genes from oocytes of the salamander Pleurodeles waltl undergoing transcription. Page 1228
RNA Backtracking MVA Fig. 26.10
Figure 31-18 A hypothetical strong (efficient) E. coli terminator.
Fig. 1 The three states of a pol II transcription elongation complex The three states of a pol II transcription elongation complex. RNA transcript is red, DNA template is blue. The nucleotide base just added to the 3'-end of RNA and the complementary base in the DNA template are represented by cyan and green bars, respectively. The dashed oval represents the empty nucleotide addition site in the posttranslocation state. The green circle represents the pol II bridge helix. D. Wang et al., Science 324, 1203 -1206 (2009) (including R. Kornberg) Published by AAAS
Simple animation Very nice animation from the PBS production DNA: The Secret of Life look for the baby chick at the beginning also the purple ribosome A pretty animation showing eukaryotic export of RNA into the cytoplasm