San
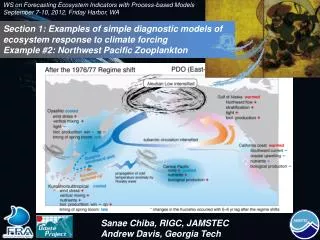
San. WS on Forecasting Ecosystem Indicators with Process-based Models September 7-10, 2012, Friday Harbor, WA. Section 1: Examples of simple diagnostic models of ecosystem response to climate forcing Example #2: Northwest Pacific Zooplankton. Sanae Chiba, RIGC, JAMSTEC

San
E N D
Presentation Transcript
San WS on Forecasting Ecosystem Indicators with Process-based Models September 7-10, 2012, Friday Harbor, WA Section 1: Examples of simple diagnostic models of ecosystem response to climate forcing Example #2: Northwest Pacific Zooplankton Sanae Chiba, RIGC, JAMSTEC Andrew Davis, Georgia Tech
Process 1 Wind-driven, Mixed Layer bottom-up process Process 2 Advective transport by oceanic currents Aleutian Low dynamics Subarctic circulation Winter Wind Stress Oceanic Currents Dynamics Winter Vertical Mixing *Lagged response in some cases Light & Nutrients availability Advection Advection Climatic forcing phytoplankton Physical environment Production Phenology Community structure Chemical environment Zooplankton Biological process Production Phenology Community structure Distribution shift Conceptual Model for Climate – Ecosystem link in the subarctic NP
Low Frequency Variation in Zooplankton Biogeography (May-Sept, Area mean) (Yatsu et al. 2012, Yeosu Symposium) < 5°C at 100 m: Oyashio > 5°C at 100 m: Transition bottom depth > 500 m Data: Odate Collection 1960-1999 37 Species Number of samples analyzed Oyashio: 961 Transition zone: 969
Distribution of Cold Water Copepod Community before & after RS in North & South Domains 1960-1975 1981-1999 (20.8%) shift (Rodionov 2006) (Chiba et al 2009, GCB)
Distribution of Warm Water Copepod Community before & after RS in North & South Domains 1960-1975 1981-1999 (15.5%) shift (Rodionov 2006) (Chiba et al 2009, GCB)
Change in Copepod Community before & after RS in North & South Domains Abundance Diversity Biogeographicaldistribution of the copepods community in the Oyashio and the Transition zone before 1976 and after 1981: total abundance (Log ind. 1000 m-3) a), species diversity (H’) b) and the average community size (mm) c). (Chiba et al 2009, GCB)
Change in Oyashio & Kuroshio after RS for 1976 ~ 1981 March-May avg. Oyashio shifted to South Kuroshio Transport increased (137°E) Year avg. Japan Meteorological Agency http://www.data.kishou.go.jp/shindan/b_2/b_2.html The timing of shift detected by method by Rodionov (2006)
Background Change in Copepod Community before & after RS in North & South Domains Both Northern and Southern Copepods concentrated in the narrow area in the Transition Region H1: In PDO positive (KO strong) yrs, more Northern (Southern) zooplankton area transported to South (North)
Passive Tracer Experiment by OFES global ocean model to assess the effect of low-frequency transport on variations in zooplankton community in the KOE OFES 3 days Output (1/10)° for 1950-2000 Climatology forcing: NCEP/NCAR reanalysis data Release: March, Count: September
Distribution of Cold Water Copepod Community before & after RS in North & South Domains x x x x 1960-1975 1981-1999 RS
Distribution of Warm Water Copepod Community before & after RS in North & South Domains x x x x 1960-1975 1981-1999 RS
Model vs. Observation: Cold Water Copepods Transport to South: Zoo-N2NB N.S. Zoo-N2NB N.S. (May-September)
Model vs. Observation: Warm Water Copepods Transport to North: Zoo-S2SB R = 0.580 Zoo-S2SB R =0.443 May-September
Background Change in Copepod Community before & after RS in North & South Domains Or.. model setting should be revised…
Time series of biomass and catch of commercially important fish species in KOE LTL-HTL Link QUESTION: Did biogeographical shift of copepods cause Spatial Match-Mismatch with HTL? Need to consider “Seasonality” in copepods transport and lifecycle for migrating fish. (Yatsu et al. 2012, Yeosu Symposium)
Seasonality in Zooplankton Transport August – September condition is most important for northward transport R
Available Zooplankton Dataset / LTL indices in subarctic western NP • Odate Collection • 1960s -1999, monthly-area mean (large missing data) • Warm-Cold species ratio (based on references) • Size index (larger or smaller than 2mm,Community mean size) • Developmental Stage of Major spp (e.g. Neocalanus spp.) • N & C SI of Major spp (e.g. Neocalanus spp.) • Species diversity (SID, ‘H) • PC Score • North Pacific CPR • 2000 - 2009, 3 transects/yr • Warm-Cold species ratio (based on references) • Size index (larger or smaller than 2mm,Community mean size) • Developmental Stage of Major spp (e.g. Neocalanus spp.) • N & C SI of Major spp (e.g. Neocalanus spp.) • Species diversity (SID, ‘H) (to be ready) • PC Score (to be ready) • Plus phytoplankton index: diatom-dinoflagellaterasio, etc.)
CPR Observation Data http://www.pices.int/projects/tcprsotnp/default.aspx/#data Cool-warm spp distribution and variation of subarctic boundary PDO & Latitudinal Shift of Neocalanus spp. North Warm North Batten, S.D. and Freeland, H.J. (2007). Fisheries Oceanography, 16, 536-646. Warm