Download
1 / 42
420 likes | 1.1k Vues
Competitive Advantage and Firm Performance. Joe Mahoney. How Do We Measure Performance?.

E N D
Competitive Advantage and Firm Performance Joe Mahoney
How Do We Measure Performance? • “The strategic aim of a business is to earn a return on capital, and if in any particular case the return in the long run is not satisfactory, then the deficiency should be corrected or the activity abandoned for a more favorable one.” • Alfred P. Sloan My Years with General Motors
Google vs. Microsoft • Google and Microsoft in multipoint competition • How to measure success of this competition? • Revenues and net income? • Performance per employee? • There are several ways to measure firm performance. • The key idea is to “triangulate” (i.e., to use multiple measures of performance to evaluate the health of the organization).
Comparing Google and Microsoft on Different Dimensions Performance viewpoint changes significantly when the measurement changes from absolute to per-employee figures (on the bottom)
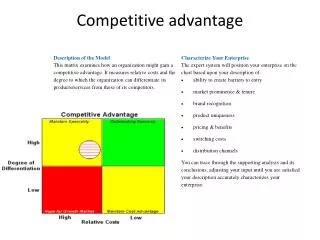
Economic Profits and Competitive Advantage • Driving a wedge between revenues and costs is how competitive advantage is created. • In strategy, we need to think simultaneously about: • The value we create for our customer; • How we capture some of the value in terms of higher prices; • The costs we incur in creating that value. • Conceptual traps that managers fall into: • Accounting costs versus Opportunity Costs • Market Share is not competitive advantage
Measuring Competitive Advantage • Always measured relative to other firms • Three standards are typical by asking: • 1. How much economic value does the firm generate? • 2. What is the firm’s accounting profitability? • 3. How much shareholder value does the firm create?
Economic Value Creation • Pizza! • Value = $12 • Price = $10 • Cost = $7 • Consumer Surplus • $12 - $10 = $2 • Producer Surplus • $10 - $7 = $3 • Economic Value • $12 - $7 = $5 • Value: A dollar amount a consumer is willing to pay for a good or service • Price: The dollar amount a good or service is offered for sale • Cost: The dollar amount to make the good or service SOLD!
Competitive Advantage and Economic Value HIGHEST VALUE – COST COMPETITIVE ADVANTAGE =
Economic Value Creation • Opportunity Costs • The next best alternative use for resources • Pizza entrepreneur • Wages $40,000 employment salary • Capital invested $25,000 interest on capital • If the restaurant made $60,000 in (accounting) profits… • The owner actually had an economic LOSS of $5,000
Economic Value as Competitive Advantage • If the economic value created is • greater than its rivals competitive advantage • equal to its rivals competitive parity • lower than its rivalscompetitive disadvantage
Sustainable Competitive Advantage and the Measurement of Performance • While we have said that the objective of strategy is to “create competitive advantage,” specifically we have the goal to maximize economic return. • Economic & Accounting Measures of Performance • Economic Profits • ROA, ROE, ROC • Financial Measures of Performance • NPV Methods
Financial Measures of Performance: NPV or DCF Analysis • The principle of discounted cash flow (DCF) analysis that firms apply to their individual projects can also be applied to the firm as a whole. Maximizing the net present value of the firm’s cash flow (“sustainable competitive advantage”) corresponds to maximization of its stock market valuation and hence maximizes the wealth of its shareholders.
Net Cash Flow • EBT - t (EBT) • EBT (1-t) = NET INCOME • EBT (1-t) + depreciation - capital expenditures = NET CASH FLOW • (note we are assuming no change in accounts receivable, no change in net working capital, no change in inventory) • Equivalent concepts: • Maximize NPV • DCF Approach • Maximize Economic Profits (EVA) • Sustainable Competitive Advantage (SCA)
Limitations of Present Value Measures • Projections are only as good as the ability of managers to measure accurately the financial consequences of actions. • An implicit assumption of value-based strategy was that business units and all investment proposals were self-contained. It was usually expected that divesting a business or curtailing an investment project would have no financial repercussions elsewhere in the corporation (e.g., ignores knowledge transfers). • Strict financial measurement of many long-term investments, particularly in intangible assets, is virtually impossible.
Limitations of Present Value Measures • Investments in R&D typically do not offer direct returns; their economic value is a strategic option to invest in new products and processes that may arise from R&D. Narrowly-defined DCF does not accurately value investments where there is significant strategic options value. • (Merck has been at the forefront of applying strategic options theory to analyze investments in R&D).
Capital Market Approaches To Measuring Performance • Market Value Added (MVA) • Market Value less Total Investment • Economic Value Added (EVA) • Operating Profit (after tax) less annual capital costs; basically, this is economic profit • Tobin’s q (Market Value/Book Value) • A firm’s market value divided by its “replacement” cost • The Market Value of the Firm - • Current Value of all securities issued by the firm
Economic Value Added (EVA) • Anheuser-Busch: Operating profit $1,756 million - taxes $617 million = $1,139 million • WACC : 67% equity at 14.3% 33% debt at 5.2% 11.3% WACC Capital of $8 billion 11.3% * $8billion = $904 million $1,139 - $904 = $235 million EVA
Firms with the Highest Ratios of Market Value to Book Value (December 2005)
Accounting Profitability • Uses standard, publicly available metrics • Permits direct firm performance comparisons • Using standard ratios • Regulated by: • Accounting principles (GAAP) • U.S. Securities & Exchange Commission (SEC) • Sarbanes-Oxley Act (2002)
Top 10 Fortune 500 Companies by Return on Revenue ROR measures the profit earned per dollar of revenue as a percentage. A size-adjusted measure of profits.
Profits vs. Return on Revenue (ROR) Ranking changes markedly with the use of different metrics 2010 Profits in $M 2010 ROR %
Accounting Profitability • Need to move beyond a “snapshot” metric • Look at more than one year of data • Permits direct firm performance comparisons • Using standard ratios • Competitive advantage is relative to competitors • Study firms in the same industry • “Apples to apples” comparisons
Firm Performance - Pharmaceutical Industry by ROR Pfizer performance declines as Merck improves and takes the competitive advantage over this period
Drawbacks for Accounting Measures • Does not consider “off balance sheet” items • Health care, pension obligations • Focuses on tangible assets, which may no longer be strategically relevant • Key is intangible assets • “Knowledge-based economy” • Manufacturing vs. services • Historical data • Backward-looking • “Driving a car by looking in the review mirror”
Shareholder Value Creation • Shareholders – legal owners of public firms • Total return to shareholders • Return on risk capital + dividends • External performance metric • Efficient-market hypothesis • All available information is embedded in the stock price • SEC requires all public firms to submit shareholder returns • Stock price based on expectations of performance
Drawbacks to Shareholder Value as Competitive Advantage • Stock prices can be highly volatile, which makes it difficult to assess firm performance (at least in the short term) • Macro economic factors (e.g., unemployment rate, economic growth or contraction, interest rate and exchange rates…) all have a direct bearing on stock prices • Stock prices frequently reflect the psychological mood of the investors, which can be at times irrational • “Irrational exuberance” Alan Greenspan, former Federal Reserve Chair
Google vs. Microsoft • Accounting perspective shows Microsoft with an advantage over Google. • But both firms have large intangible assets. • BUT shareholder value favors Google over Microsoft! • Microsoft stock is flat while Google is up 200%.
Comparing Google and Microsoft Using ROE and ROA Microsoft outperforms Google in 2010 based on this accounting data
Normalized Stock Returns 2005–2010 Google is enjoying a sustained competitive advantage over Microsoft based on shareholder value.
THE BALANCED SCORECARD • Advantages • Communicate vision thru the organization • Translate vision into measureable goals • Design business processes • Implement organizational learning • Disadvantages • Tool for strategy implementationnot formulation. • Limited guidance on selecting metrics • Limited insight on how to get back on track to meet goals • Can be viewed as just a tracking tool for metrics
The Triple Bottom Line The Triple Bottom Line • Financial, Social, and Ecological Considerations • Also known as "People, Planet, & Profits" • BP oil spill had many major effects • BMW changed car designs to enhance recycling • Integrative approach for sustainable strategy
Implications for the Strategist • Both quantitative AND qualitative performance dimensions matter. • Managers need to have a holistic view • Competitive advantage is best by criteria, reflecting overall company performance • Metrics aggregate upward, useful to gauge firm's strategy • Only better strategy is our goal. • No best strategy exists • Strategic performance metrics must be relative