Download
1 / 25
250 likes | 514 Vues
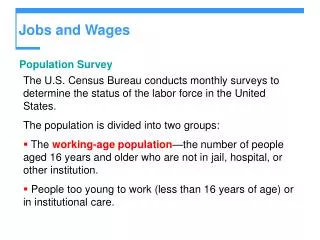
Jobs and Wages. Population Survey The U.S. Census Bureau conducts monthly surveys to determine the status of the labor force in the United States. The population is divided into two groups:

E N D
Jobs and Wages • Population Survey • The U.S. Census Bureau conducts monthly surveys to determine the status of the labor force in the United States. • The population is divided into two groups: • The working-age population—the number of people aged 16 years and older who are not in jail, hospital, or other institution. • People too young to work (less than 16 years of age) or in institutional care.
Jobs and Wages • The working-age population is divided into two groups: • People in the labor force • People not in the labor force • The labor force is the sum of employed and unemployed workers.
Jobs and Wages • To be considered unemployed, a person must be: • without work and have made specific efforts to find a job within the past four weeks, or • waiting to be called back to a job from which he or she was laid off, or • waiting to start a new job within 30 days.
Jobs and Wages • Figure 6.2 shows the population labor force categories for 2003.
Jobs and Wages • Three Labor Market Indicators • The unemployment rate is the percentage of the labor force that is unemployed. • The unemployment rate is (Number of people unemployed/Labor force) 100. • The unemployment rate reaches its peaks during recessions.
Jobs and Wages • Three Labor Market Indicators • The labor force participation rate is the percentage of the working-age population that is in the labor force. • The labor force participation rate is (Labor force/Working-age population) 100. • The labor force participation rate has increased from 59 percent in the 1960s to 67 percent in the 1990s. • The labor force participation rate for men has declined, but for women has increased.
Jobs and Wages • Three Labor Market Indicators • The labor force participation rate falls during recessions as discouraged workers—people available and willing to work but who have not made an effort to find work within the last four weeks—leave the labor force.
Jobs and Wages • Three Labor Market Indicators • The employment-to-population ratio is the percentage of working-age people who have jobs. • The employment-to-population ratio is (Number of people employed/Working-age population) 100. • The employment-to-population ratio has increased from 55 percent in the early 1960s to 67 percent in 2000. • The employment-to-population ratio has declined for men and increased for women.
Jobs and Wages • Three Labor Market Indicators • Figure 6.3 shows the three labor market indicators for 1963–2003.
Jobs and Wages • Figure 6.4 shows the changing face of the labor market– participation rates and employment-to-population ratios for males and females separately.
Jobs and Wages • Aggregate Hours • Aggregate hours are the total number of hours worked by all workers during a year. • Aggregate hours have increased since 1960 but less rapidly than the total number of workers because the average workweek has shortened.
Jobs and Wages • Aggregate Hours • Figure 6.5 shows aggregate hours...
Jobs and Wages • Aggregate Hours • Figure 6.5 shows aggregate hours … • and average weekly hours per person, 1963–2003.
Jobs and Wages • Real Wage Rate • The real wage rate is the quantity of goods and services that can be purchased with an hour’s work. • The real wage rate equals the money wage rate divided by the price level—the GDP deflator. • Three measures are • Hourly earnings in manufacturing • Total wages and salaries per hour • Total wages, salaries, and supplements per hour
Jobs and Wages • Figure 6.6 shows the three measures of real wage rates for 1963–2003.
Unemployment and Full Employment • The Anatomy of Unemployment • Three types of people are unemployed • Job losers—workers who have been laid off or fired and are searching for new jobs. • Job leavers—workers who have voluntarily quit their jobs to look for new ones. Job leavers are the smallest fraction of the unemployed. • Entrants and reentrants—people entering the labor force for the first time or returning to the labor force and searching for work.
Unemployment and Full Employment • The Anatomy of Unemployment • People end a spell of unemployment for two reasons • Hired or recalled workers gain jobs. • Discouraged unemployed workers withdraw from the labor force.
Unemployment and Full Employment • Figure 6.7 illustrates the labor market flows between the different states.
Unemployment and Full Employment • Figure 6.8 shows unemployment by reason, 1963–2003. • Job leavers are the smallest group. • Job losers are the largest and the most cyclical group.
Unemployment and Full Employment • The duration of unemployment increases during recessions and Figure 6.9 shows unemployment by duration close to a business cycle peak in 2000… • … and close to a trough in 2002.
Unemployment and Full Employment • Figure 6.10 shows the unemployment rates of teenagers and adults, whites and blacks close to a business cycle peak in 2000… • … and close to a trough in 1992. • Young black men experience the highest unemployment rates.
Unemployment and Full Employment • Types of Unemployment • Unemployment can be classified into three types: • Frictional • Structural • Cyclical
Unemployment and Full Employment • Types of Unemployment • Frictional unemployment is unemployment that arises from normal labor market turnover. • The creation and destruction of jobs requires that unemployed workers search for new jobs. • Increases in the number of young people entering the labor force and increases in unemployment benefit payments raise frictional unemployment.
Unemployment and Full Employment • Types of Unemployment • Structural unemployment is unemployment created by changes in technology and foreign competition that change the match between the skills necessary to perform jobs and the locations of jobs, and the skills and location of the labor force. • Cyclical unemployment is the fluctuation in unemployment caused by the business cycle.
Unemployment and Full Employment • Full Employment • Full employment occurs when there is no cyclical unemployment or, equivalently, when all unemployment is frictional or structural. • The unemployment rate at full employment is called the natural rate of unemployment. • The natural rate of unemployment is estimated to have been around 6 percent on the average in the United States, but during the 1990s, the natural unemployment rate fell below 6 percent.