Download
1 / 26
270 likes | 430 Vues
Large-scale Satellite Oceanography in Eastern Pacific Upwelling Regions. Andrew Thomas University of Maine Recent manuscript collaborators: Jose Luis Blanco, Mary Elena Carr, Scott Nixon, Jorge Ossus, Ted Strub. Valparaiso, January 2003. Interests - Overview.

E N D
Large-scale Satellite Oceanography in Eastern Pacific Upwelling Regions Andrew Thomas University of Maine Recent manuscript collaborators: Jose Luis Blanco, Mary Elena Carr, Scott Nixon, Jorge Ossus, Ted Strub Valparaiso, January 2003
Interests - Overview • Coupling between wind forcing, hydrographic patterns and biological response • Focus on phytoplankton biomass response • Large-scale view (remote sensing data) • requires collaboration - for in situ data • - expert local knowledge • - I don’t know much • Comparisons between eastern boundary current regions • California Current – Humboldt Current • Benguela Current – Canary Current • links to basin scale patterns & low latitude forcing (& high latitude forcing)
Older BackgroundmySouth American efforts Still don’t know much Carr M-E., P.T. Strub, A.C. Thomas and J.L. Blanco, 2002, Evolution of 1996-1999 La Nina and El Nino conditions off the western coast of South America: a remote sensing perspective, J. Geophys. Res. Blanco J.L., M-E. Carr, A.C. Thomas and P.T. Strub, 2002, Hydrographic conditions off northern Chile during the 1996-1998 La Nina and El Nino, J. Geophys. Res. Thomas A.C., M.E. Carr and P. T. Strub, 2001, Chlorophyll variability in eastern boundary currents, Geophys. Res. Lett. Nixon, S.W. and A.C. Thomas, 2001, On the size of the Peru upwelling ecosystem. Deep Sea Res. I. Blanco J.L., A.C. Thomas, M-E. Carr and P.T. Strub, 2001, Seasonal climatology of hydrographic conditions in the upwelling region off northern Chile, J. Geophys. Res. Thomas A.C., J.L. Blanco, M.E. Carr, P.T. Strub and J. Ossus, 2001, Satellite-measured chlorophyll and temperature variability off northern Chile during the 1996-1998 La Nina and El Nino, J. Geophys. Res. Thomas A.C., P. T. Strub, M.E. Carr and R. Weatherbee, 2003. Comparisons of chlorophyll variability between the four major global eastern boundary currents. Int. J. Rem. Sens. Thomas, A.C. 1999, Seasonal distributions of satellite-measured phytoplankton pigment concentration along the Chilean coast. J. Geophys. Res. Hill, A.E., B.M.Hickey, F.A.Shillington, P.T.Strub, K.H. Brink, E.D.Barton, A.C. Thomas, 1998. Eastern Boundary Currents: A Pan-Regional Review. In: The Sea. A.R. Robinson and K.H. Brink, Editors. J.Wiley and Sons Inc. Thomas, A.C., P.T. Strub and S. Levesque. 1994. Satellite measured ocean color variability at large spatial and temporal scales. World Meteorological Organization, UNESCO. Thomas, A.C., P.T. Strub, F. Huang and C. James. 1994. A comparison of the seasonal and interannual variability of phytoplankton pigment concentrations in the Peru and California Current System. J. Geophys. Res. Carr M-E., P.T. Strub, A.C. Thomas and J.L. Blanco, 2002, Evolution of 1996-1999 La Nina and El Nino conditions off the western coast of South America: a remote sensing perspective, J. Geophys. Res. Blanco J.L., M-E. Carr, A.C. Thomas and P.T. Strub, 2002, Hydrographic conditions off northern Chile during the 1996-1998 La Nina and El Nino, J. Geophys. Res. Thomas A.C., M.E. Carr and P. T. Strub, 2001, Chlorophyll variability in eastern boundary currents, Geophys. Res. Lett. Nixon, S.W. and A.C. Thomas, 2001, On the size of the Peru upwelling ecosystem. Deep Sea Res. Blanco J.L., A.C. Thomas, M-E. Carr and P.T. Strub, 2001, Seasonal climatology of hydrographic conditions in the upwelling region off northern Chile, J. Geophys. Res. Thomas A.C., J.L. Blanco, M.E. Carr, P.T. Strub and J. Ossus, 2001, Satellite-measured chlorophyll and temperature variability off northern Chile during the 1996-1998 La Nina and El Nino, J. Geophys. Res. Younger Didn’t know much
Seasonal Cycles - monthly SeaWiFS composites Based on newest (2002) SeaWiFS processing February July
Seasonal Cycles – GRL 2001 SeaWiFS (3 years) CZCS (7 years) summer summer Wind CHL summer summer Summer Centered in each Hemisphere Amplitude Phase r2
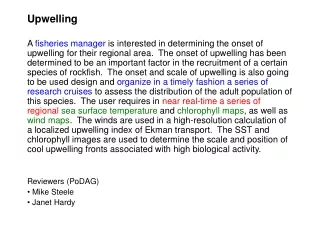
~30o latitudinal boundary Noted in CZCS data [Thomas 1999 JGR] Very evident in SeaWiFS / Wind / SST data [Thomas et al. 2001 GRL] ….as Rubén showed yesterday with other data
Interannual Variability 3 years – GRL 2001 a preliminary view
Interannual Variability SeaWiFS (4 years) - monthly CONCENTRATIONS – 100km mean SeaWiFS (4 years) - monthly ANOMALIES – 100km mean 1997 1998 1999 2000 2001 1997 1998 1999 2000 2001 Work in progress – presented at 2002 Ocean Sciences Meeting
Examine EL NIÑO Timing and structure Compare Northern Hemisphere response to Southern Hemisphere responsemulti-disciplinary satellite dataaltimeter anomalies – ERS & TOPEXSST anomalies – NOAA AVHRRchlorophyll anomalies – SeaWiFSEkman transport – ERS & QuikSCAT Work in progress – presented at 2002 Viña El Niño Conference
El Nino Comparisons N & S: Timing ALTIMETER: Sea Surface Height Residuals (1997-1998) Low latitudes Baja VS N.Chile Mid latitudes High Sea Levels SeaWiFS Data Begins 1997 1998
Anomaly Time Series 1997-98 Baja VS N. Chile (~28N-22oS) Data: Height (SSH) Baja N. Chile 1997 1998
Anomaly Time Series 1997-98 Baja VS N. Chile (~28N-22oS) Data: Height (SSH) & SST Baja « @ 21oN N. Chile 1997 1998
Anomaly Time Series 1997-98 Baja VS N. Chile (~28N-22oS) Data: Height (SSH) & SST & CHL Baja N. Chile 1997 1998
Anomaly Time Series 1997-98 Baja VS N. Chile (~28N-22oS) Data: Height (SSH) & SST & CHL & WIND (Ekman) Baja N. Chile 1997 1998
Anomaly Time Series 1997-98 MID Latitudes (~35o N&S) Data: Height (SSH) California Chile 1997 1998
Anomaly Time Series 1997-98 MID Latitudes (~35o N&S) Data: Height (SSH) & SST California Chile 1997 1998
Anomaly Time Series 1997-98 MID Latitudes (~35o N&S) Data: Height (SSH) & SST & CHL California Chile 1997 1998
Anomaly Time Series 1997-98 MID Latitudes (~35o N&S) Data: Height (SSH) & SST & CHL & Wind (EKMAN) California Work in Progress Chile 1997 1998
VARIABILITY ANALYSIS 5 year time series of monthly SeaWiFS data 21.4% 1997 1998 1999 2000 2001 2002 1997 1998 1999 2000 2001 2002
Monthly anomalies (from new [2002 processing] data) September 1997 October 1997 November 1997
Monthly anomalies (from new [2002 processing] data) December 1997 January 1998 February 1998
Monthly anomalies (from new [2002 processing] data) May 1998 June 1998 July 1998
Large Positive Anomalies off North America in 2002 !! Presented at November 2002 GLOBEC meeting (Oregon) EOF (pattern) April 2002 EOF (time series) May 2002
Summary Data: SeaWiFS & MODIS color AVHRR & MODIS SST QuikSCAT & ERS wind TOPEX & ERS heights So much to do…..so much fun….. Send students! gracias