Download
1 / 7
70 likes | 160 Vues
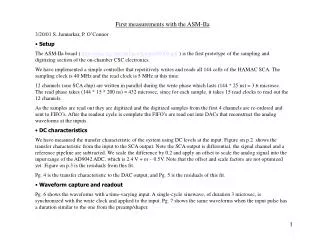
First measurements with the ASM-IIa 3/20/01 S. Junnarkar, P. O’Connor Setup The ASM-IIa board ( http://atlas-csc.inst.bnl.gov/list/pdf00000.pdf ) is the first prototype of the sampling and digitizing section of the on-chamber CSC electronics.

E N D
First measurements with the ASM-IIa • 3/20/01 S. Junnarkar, P. O’Connor • Setup • The ASM-IIa board ( http://atlas-csc.inst.bnl.gov/list/pdf00000.pdf ) is the first prototype of the sampling and digitizing section of the on-chamber CSC electronics. • We have implemented a simple controller that repetitively writes and reads all 144 cells of the HAMAC SCA. The sampling clock is 40 MHz and the read clock is 5 MHz at this time. • 12 channels (one SCA chip) are written in parallel during the write phase which lasts (144 * 25 ns) = 3.6 microsec. The read phase takes (144 * 15 * 200 ns) = 432 microsec, since for each sample, it takes 15 read clocks to read out the 12 channels. • As the samples are read out they are digitized and the digitized samples from the first 4 channels are re-ordered and sent to FIFO’s. After the readout cycle is complete the FIFO’s are read out into DACs that reconstruct the analog waveforms at the inputs. • DC characteristics • We have measured the transfer characteristic of the system using DC levels at the input. Figure on p.2 shows the transfer characteristic from the input to the SCA output. Note the SCA output is differential, the signal channel and a reference pipeline are subtracted. We scale the difference by 0.2 and apply an offset to scale the analog signal into the input range of the AD9042 ADC, which is 2.4 V + or – 0.5V. Note that the offset and scale factors are not optimized yet. Figure on p.3 is the residuals from this fit. • Pg. 4 is the transfer characteristic to the DAC output, and Pg. 5 is the residuals of this fit. • Waveform capture and readout • Pg. 6 shows the waveforms with a time-varying input. A single-cycle sinewave, of duration 3 microsec, is synchronized with the write clock and applied to the input. Pg. 7 shows the same waveforms when the input pulse has a duration similar to the one from the preamp/shaper.
ASMII-a waveforms – 3 ms sinewave input SCA output SCA input to Ch. 32 – sampled at 40 MHz Digitized SCA output reconstructed at 5 MHz
ASMII-a waveforms – pulse with same duration as P/S input Digitized SCA output reconstructed at 5 MHz