Download
1 / 13
130 likes | 276 Vues
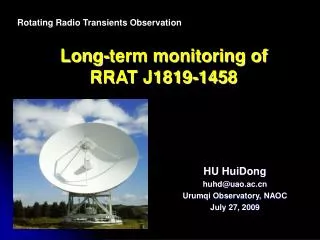
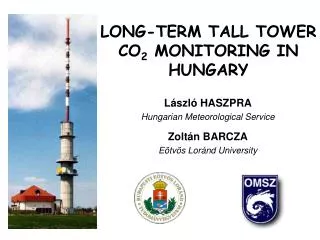
LONG-TERM TALL TOWER CO 2 MONITORING IN HUNGARY. László HASZPRA Hungarian Meteorological Service Zoltán BARCZA Eötvös Loránd University. Hegyhátsál is located at 46°57'N, 16°39'E, 248 m above the sea level. 15 O E. 16 O E. 17 O E. 18 O E. 19 O E. 48 O N. 47 O N. 46 O N. .

E N D
LONG-TERM TALL TOWER CO2 MONITORING IN HUNGARY László HASZPRA Hungarian Meteorological Service Zoltán BARCZA Eötvös Loránd University
Hegyhátsál is located at 46°57'N, 16°39'E, 248 m above the sea level 15OE 16OE 17OE 18OE 19OE 48ON 47ON 46ON
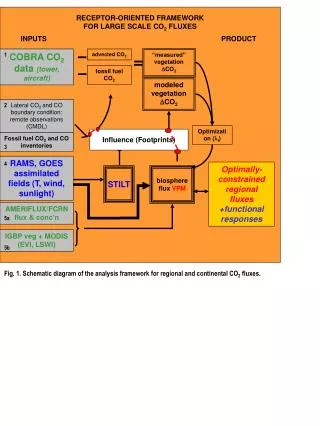
• 1994 CO2 vertical profile measurements (10 m, 48 m, 82 m, 115 m) • 1993 weekly NOAA flask sampling at 96 m • 1997 CO2 vertical flux measurements (eddy covariance method, 82 m) • 2001 regular aircraftmeas-urementsover the tower up to 3000 m above ground
Early afternoon parallel in-situ measurements and flask samples (NOAA) can be used for quality control The slight deviation can be explained by the relatively high temporal variability, the non-perfect synchronization of the in-situ measurements and the flask sampling and by the difference in the sampling elevations
black line = marine boundary layer (mbl) Combined data series of the two Hungarian CO2 monitoring stationsK-puszta (KPU, 46º58'N, 19º33'E, 125 m, 1981-1999) and Hegyhátsál (HHS, 46º57'N, 16º39'E, 248 m, 1994- )
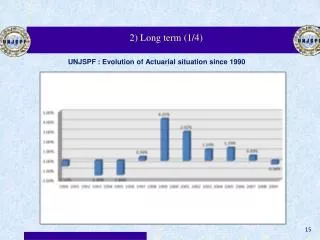
Detrended data series Annual amplitude is decreasing (36.5 ppm → 28.7 ppm, 0.78 ppm/yr) Change is not symmetric
CO2 deficit season Changing shape of the seasonal cycle Increase of the length of the CO2 deficit season is approx. 1 day/year Increasing length of the growing season?
Possible reasons for the decreasing annual amplitude: • decreasing anthropogenic emission • in Hungary and in the neighbouring countries anthropogenic CO2 emission hardly changed between 1994 and 2004 • decreasing atmospheric stability, circulation • no sign of significant changes • decreasing biospheric uptake
winter:1.91 ppm/yr autumn:1.78 ppm/yr annual:1.85 ppm/yr spring:1.53 ppm/yr summer:2.17 ppm/yr mbl: 1.82 ppm/yr lower than average increase in spring (Mar-May),higher than average increase in summer (Jun-Aug) sign of earlier start of the growing season or more intensive biospheric uptake in spring sign of decreasing summer biospheric uptake
slightly increasing carbon uptake in March → earlier start of the growing season no change in April decreasing carbon uptake from May to August (especially in late summer[July-August]) daytime (08-16 h LST) NEE
800 March - Octoberprecipitation (mm) vapour pressure deficit may give higher correlation 700 600 1960-1990 average 500 March – Octobertemperature (oC) 400 16 14 1960-1990 average 100 12 no measurements NEE (g C/m2/yr) 50 0 -50 Haszpra et al., 2005: Long term tall tower carbon dioxide flux monitoring over an area of mixed vegetation. Agricultural and Forest Meteorology 132, 58-77. -100 -150
Conclusions: • in addition to the results of other methods the changes in the temporal variation of CO2 mixing ratio and the early spring trend in the biosphere-atmosphere carbon exchange rate also indicate the earlier start of the growing season • the gradually drier and warmer than average weather in the growing season resulted in decreasing biospheric carbon uptake between the late 90’s and 2003, turning the region to net carbon source by 2003 • this climate anomaly period seemed to be interrupted in the influence region of the station in 2004, and the region acted again as a net carbon sink • the measurements give the experimental evidence that the expected drier and warmer future climate may turn the region into a significant net natural carbon source


![Using Virtual Tall Tower [CO 2 ] Data in Global Inversions](https://cdn1.slideserve.com/3052018/using-virtual-tall-tower-co-2-data-in-global-inversions-dt.jpg)