Download
1 / 59
610 likes | 830 Vues
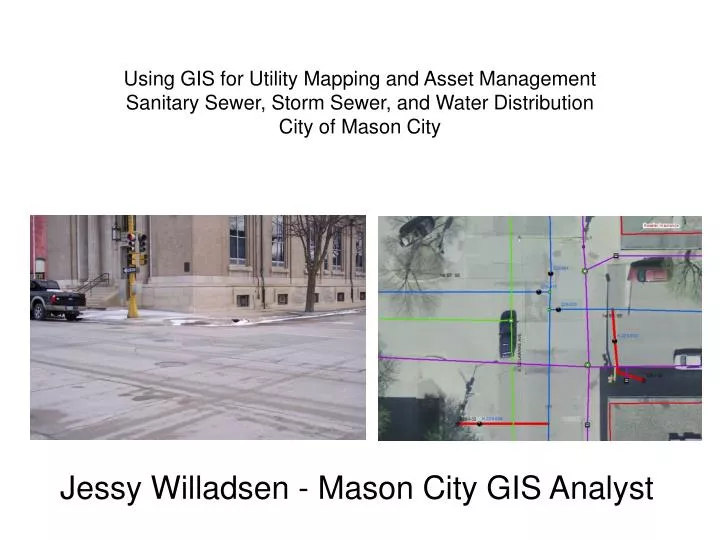
Using GIS for Utility Mapping and Asset Management Sanitary Sewer, Storm Sewer, and Water Distribution City of Mason City. Jessy Willadsen - Mason City GIS Analyst. First Question: Why include utilities into your GIS?. View information graphically. View different layers together.

E N D
Using GIS for Utility Mapping and Asset ManagementSanitary Sewer, Storm Sewer, and Water DistributionCity of Mason City Jessy Willadsen - Mason City GIS Analyst
First Question: Why include utilities into your GIS? • View information graphically. • View different layers together. • Store attribute information about features. • Link features to scanned records. • You only have to store the location of features once. • 80-90% of data maintained by government has a spatial component.
Where do you start? • Went to each department to evaluate what their GIS needs were. • Features requested • Attributes needed • Potential use of data (use this for prioritization) • Planned source to collect the features and what method will be used to create the data.
What GIS layers should be created. What data will be needed to create these GIS layers. Where is this data located. Prioritize what GIS layers will be created first. Needs Assessment
Creating data • GPS Data collection: Collect features by GPS and import them into the GIS system. • Aerial photography interpretation: Example, you can see manholes in the aerial photography. • Measurements from known locations: Example: Measure water valve from the center of the road or from property corners.
Purchase of Survey Grade GPS • In 2008, the City purchased survey grade GPS equipment. • The Leica GPS 1200 unit utilizes the Iowa Real Time Network. • Using a cellular modem, the GPS controller receives correction data from the internet in real time.
Engineering and Operations & Maintenance Priorities • Sanitary Sewer System • Storm Sewer System • Water Distribution System • Road infrastructure
Primary Features: Mains Manholes Other features Mapped: Caps and plugs Cleanout Private mains and manholes Service lines including wyes and stubs Repairs Sanitary Sewer
Sanitary Sewer Evolution • CAD Files converted to GIS • Improvement of location in GIS of Mains and Manholes • Link to external database • Link to field books for each service • Link to CCTV sewer videos. • Link to sewer profiles. • Repair Mapping
Sanitary Sewer Future Development / Ideas • Maintain existing functionality • Complete GPS collection of all manholes • Map service connections • Scan plans and link to GIS.
Sanitary Sewer Common attributes • Pipe Material • Pipe Size • More?
Primary Features Valves Hydrants Mains Junctions Other features Mapped Service lines Cutoffs and Corporation Turning zones and Flushing routes Main breaks Wells, Water Towers, Booster Stations, and reservoirs Reducers and Hydra-stoppers Water Distribution
Water Distribution Evolution • No Usable CAD files to import • GPS collected valves and hydrants • Draw mains using water book as reference. • Used database as reference also which contained measurements from the center of the road and sidewalk.
Water Distribution Features • Link to external database for valves and hydrants • Link to external database for service points
Water Distribution Typical Attributes • Pipe Material • Pipe Diameter • Valve Type (Main or Hydrant) • Cutoff Address
Water Distribution Future Development/Ideas • Maintain existing advancements. • Migrate the microsoft access database to an enterprise database such as postgre. • Scan service records for each water service and link to GIS. • Continue GPS collecting Valves, Hydrants, and Water Cutoffs. • Link service data to cutoffs.
Storm Sewer • Primary Features • Main • Intake • Manhole • Discharge
Storm Sewer • Other features Mapped • Abandoned pipe • Districts • Lift Station • Private mains, intakes • Services