Understanding the UV Index: Health Effects and Forecasting
410 likes | 536 Vues
Delve into the impacts of UV radiation on health, from short-term sunburn to long-term effects like skin cancer and cataracts. Learn about factors influencing UV levels and the history of UV Index development, including future forecasting methods.

Understanding the UV Index: Health Effects and Forecasting
E N D
Presentation Transcript
UltraViolet Index Craig S. Long National Oceanic and Atmospheric Administration National Weather Service National Centers for Environmental Prediction Climate Prediction Center
Outline • Background information on UV radiation • Factors that affect UV radiation • Health effects • History of UV Index • WMO/WHO Standards • NWS UV Index Algorithm • Current • Future • Products
Background • Definition: • UV Index is a scaled erythemal (skin reddening) dose rate integrated over the UV-B and UV-A spectral bands. • WMO guidelines require forecasts to be generated at least for next day at solar noontime.
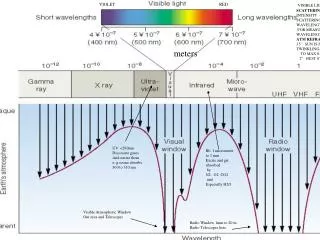
Background • UltraViolet radiation has shorter/more powerful wavelengths than visible light. • The most dangerous wavelengths of UV spectrum (UV-C) are completely absorbed in the stratosphere. • Partial absorption of UV-B • Minor absorption of UV-A
UV Health Effects • Short Term overexposure to UV-B: • UV-B causes sunburn (erythema) • Sunburn can prevent your body from eliminating heat efficiently and can contribute to heat stress • Long Term overexposure to UV-B: • Several severe sun burns linked to melanoma • One person dies of skin cancer per hour in the U.S. • Sustained exposure linked to squamous and basal skin cancers – non lethal • Cataracts of eyes • Long Term overexposure to UV-A: • Aging of skin • Loss of elasticity (leathery look) • Small amounts of UV radiation needed for Vitamin-D
Background • Factors affecting UV radiation from TOA to surface: • Flux at TOA • Earth – Sun distance • Ozone (total column) • Solar Zenith Angle • Latitude, Day of Year • Clouds • Aerosols • Elevation • Surface Albedo • No Snow • Snow
History • 1980’s: Australia started reporting yesterday’s UV radiation levels in conjunction with huge sun protection campaign. • 1992: Environment Canada began issuing a next day forecast of clear sky UV levels called ‘UV Index’. • 1994: NWS and EPA begin issuing a next day forecast w/cloud effects. Use slightly different scale than Canadians. Allowed to use name ‘UV Index’. • 1995: WMO holds “meeting of experts” to establish UV Index definition. • 1997: WMO holds second “meeting of experts” to standardize UV Index name and forecasts • 2000: WHO holds meeting to standardize health messages and exposure categories.
UV Index Definition • UV Index is a scaled erythemal dose rate integrated over the UV-B and UV-A spectral bands.
Erythemal Dose Rate • EDR = Integral over the 290 to 400 nm range • EDR = ~0.250 Watts/m2or 250 mW/m2. • Erythemal Dose Rate is the instantaneous flux of skin reddening UV radiation. • UV Index is the EDR(W/m2) x 40. • Or EDR(mW/m2)/25 • UV Index = 10.0
Radiative Transfer Models • RTMs are needed to determine “clear sky” UV flux at surface under prescribed conditions. • SZA • Ozone • Aerosols • Elevation • Albedo • Several types of RTMs: • multiple scattering spectral models • fast spectral models • empirical models • RTMs are computationally expensive • Operational forecasts of large gridded fields require the creation of Look Up Tables
Results from Spectral Radiative Transfer Model Tropics Extra Tropics Ozone Hole
UV Index Forecast Future UV Fcst Ozone Forecasts from GFS Albedo no snow = 3% Snow = >30% (GFS Albedo) Elevation 9% 1st km 7% 2nd km 6% 3rd km Aerosol Variable from climatology Cloud attenuation from GFS shortwave code Products: 58 city bulletin Global Cloudy and Clear Sky grids • Current UV Fcst • Ozone Forecast from GFS • Albedo = 5% (no snow) • Elevation (6% per Km) • Aerosol – clean atmosphere (AOD=0.2, SSA=1.0) • Clouds amounts from MOS • Products: • 58 city bulletin • Clear sky UV Index on global 1x1 grid • Cloudy UV Index for CONUS and AK grids
UV Index Forecast • 3 Forecasts in one • Ozone Forecast • Cloud Forecast • Aerosol Forecast (not there yet)
Global Ozone Field Ozone Hole
Elevation Effect Breckenridge, CO Yellowstone, WY Jackson, WY Boulder, CO Lubbock, TX Binghamton, NY
Albedo • Surface has low albedo is UV ~ 3% • Sand is more reflective ~30% • Snow is most reflective ~30-90%
Aerosols scatter and absorb UV radiation Reduce direct and Increase diffuse Global is usually attenuated Aerosol parameters include: Aerosol Optical Depth Single Scattering Albedo Ratio of scattered /(scattered + absorbed) Asymmetry factor Forward scattering vs backward scattering Aerosol Effects
Aerosol Optical Depth Single Scattering Albedo Aerosol Climatology
Cloud Forecasts • Current Method: MOS clouds • MOS fcsts Pct Clear, Scattered, Broken, Overcast • Regression determined by comparing MOS fcsts against observed cloud transmission • Clear (0-1 tenths): 100% transmission • Scattered(2-5 tenths): 89% • Broken(6-8 tenths): 72% • Overcast(9-10 tenths): 31% • Proposed Method: From GFS Shortwave scheme • UV Transmission = UVCloud/UVNo Cloud
Products: Cloudy UV Index Output Grids Eta Grid 207 Eta Grid 211
UV Index “to do” list • Generate and validate global noon time UV Index fcsts • EMC must operationally output UVcloud and UVno-cloud surface fluxes • Generate UV Index forecasts out to day 5 • Generate UV Index forecasts at both 00Z and 12Z cycles • Generate daily UV dosage • Diurnal variation