
Milepost Data and Time Intervals Analysis
This document presents an analysis of milepost data points at intervals of 10, 15, 20, 25, and 30 miles, along with various time intervals ranging from 20 seconds to 15 minutes. The milepost coordinates are represented as a series of sequences that can be used to track geographical locations along a route. The time data indicates the duration taken at each milepost, providing insights into travel speed and performance over specified distances. Such analysis can help in logistical planning and route optimization.

Milepost Data and Time Intervals Analysis
E N D
Presentation Transcript
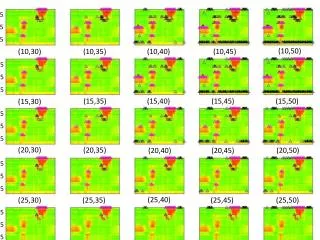
305 295 285 milepost (10,50) (10,30) (10,35) (10,40) (10,45) 305 295 285 milepost (15,35) (15,40) (15,45) (15,50) (15,30) 305 295 285 milepost (20,30) (20,35) (20,50) (20,40) (20,45) 305 295 285 milepost (25,40) (25,30) (25,35) (25,50) (25,45) 305 295 285 milepost (30,30) (30,35) (30,40) (30,45) (30,50) 0 12 24 0 12 24 0 12 24 0 12 24 0 12 24 time time time time time
305 295 285 milepost (10,50) 20 sec 20 sec 20 sec 1 min 1 min 1 min 3 min 3 min 3 min 5 min 5 min 5 min 15 min 15 min 15 min 305 295 285 milepost (20,40) 305 295 285 milepost (30,30) 0 12 24 0 12 24 0 12 24 0 12 24 0 12 24 time time time time time