Futurcast Web EASY Tutorial
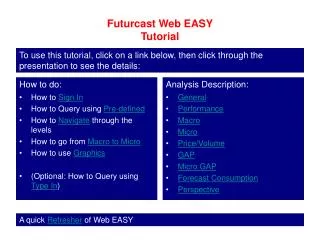
How to Sign In How to Query using Pre-defined How to Navigate through the levels How to go from Macro to Micro How to use Graphics (Optional: How to Query using Type In ). General Performance Macro Micro Price/Volume GAP Micro GAP Forecast Consumption Perspective.

Futurcast Web EASY Tutorial
E N D
Presentation Transcript
How to Sign In How to Query using Pre-defined How to Navigate through the levels How to go from Macro to Micro How to use Graphics (Optional: How to Query using Type In) General Performance Macro Micro Price/Volume GAP Micro GAP Forecast Consumption Perspective Futurcast Web EASYTutorial To use this tutorial, click on a link below, then click through the presentation to see the details: How to do: Analysis Description: A quick Refresher of Web EASY
Sign in using your Futurcast User Name and Password. Important: Use Capital letters in both User Name and Password! Sign-In
Select the desired Analysis Type from the list Pre-defined
Select the desired Analysis Type from the list Select Pre-defined as query type Pre-defined
Select the desired Analysis Type from the list Select Pre-defined as query type Click on Next Pre-defined
Select the pre-defined reporting level from this list Pre-Defined
Select Display parameters Pre-Defined
Select Display parameters Scale: Show the numbers in absolutes or scale in thousands for example. Pre-Defined
Select Display parameters Records: The number of records to be displayed. The lower the number of records the faster the response. Note: The totals at the bottom of each report always reflect the total records in the query independent of the number of records displayed. Pre-Defined
Select Display parameters Description: The items reported can be displayed by code only, or with a description column added. Pre-Defined
Select Display parameters Order by: Select the Sort Order in the report. Note: The Sort Order can be changed from within the reports by clicking on any underlined Column Heading. Pre-Defined
Select Display parameters Year/Month: Select the first period to be displayed. Note: This menu option is only available for the Perspective Analysis. Pre-Defined
Click on “Get Results” to display the report Pre-Defined
Select the desired Analysis Type from the list Select Type-in as query type Type-in
An additional menu allowing query input appears Specify Country to be reported Specify the data level to be reported Type-In
Continue query input in this menu Specify which Total Group should be reported Type-In
Specify the measure that should be reported Type-In Note that some of these measures might not be available in your implementation of Web-Easy
Finally, select the display parameters. (Note: Review the section on Pre-Defined Queries to see details of the Parameters) Type-In
Navigation Navigation from level to level, or the capability to “drill down”, can be executed from within each Web Easy Analysis.
To view each Brand’s performance, click on the white button next to the PHARMACO level. Navigation
Select the desired level from the Report Dimension Selection list Navigation
Click on Submit Navigation
The result is the Performance Report with all of the Brands listed Navigation
To drill down to see how each of the SKUs of a brand performed, click the White Button next to the Brand Navigation
Select SKU from the Report Dimension Selection list Navigation
Click on Submit Navigation
Each SKU of Mafeking is now displayed Navigation
To return back to the previous level, just click the Back button of the browser. Navigation
Navigation You are back at the Brand level were you can drill down and see the SKU detail of another Brand.
Macro to Micro The Micro reports are extensions of their respective Macro reports. The Micro Analysis extends the Macro Analysis and the Micro GAP Analysis extends the GAP Analysis. This means that no Pre-defined Queries exists for the Micro Analysis. The recommended method for access to a Micro Analysis is to call it up while in the corresponding Macro Analysis. Note that the Micro Analysis can be called up from within the Performance Analysis and the Price\Volume Analysis as well as the Macro Analysis.
While navigating through the levels in the Macro Analysis, you can call up the Micro information for an entity by clicking on the Colored Button next to the code. Macro to Micro
Macro to Micro The resulting Micro Analysis is opened in a separate window. When you have finished reviewing it, just close it, and you are back in the Macro Analysis where you can select another entity and review its Micro Analysis.
General The upper line in this section which appears in all the reports, gives reference to the parameters selected in the Query. The lower line gives reference to the display parameters selected. Click on the white button next to Mafeking to conduct a drill down to SKU level.
Note that reference about the drill down level now appears in an additional line General
These comparisons are provided for the Current Month and Year to Date. The Moving Annual Total column shows the Actual sales for the last 12 months. The Yearly Budget column shows the Annual budget. Performance The Performance Analysis compares Current Year sales to Previous Year sales and Budget.
The Latest Forecast column shows the forecasted annual figure for the year. This figure is the sum of the Actuals Year to Date and the Forecast Year to Go. Performance Performance
Annual Actual sales two years ago. Annual Actual sales Last Year. Year to Date sales in Current Year Macro The Macro Analysis compares the annual Forecasts with the Budget and Actual sales from the last two years. The Columns of the report consist of:
Annual Budget for Current Year. Futurcast Reference Forecast for Current Year. Official Forecast (including Adjustments) for Current Year. Official Forecast (including Adjustments) for Next Year. Macro The Columns of the report consist of:
The last row shows the growth rate from year ago for each column where applicable. Note that the Total of each column is listed in red at the bottom. Macro
Note: The Growth Rate figure for YTD Current Year is calculated against the same period last year. Macro
Macro Annual Actual sales two years ago. Annual Actual sales Last Year. Year to Date sales for Current Year Micro The Columns of the report consist of: The Micro Analysis is an extension of the Macro Analysis in that it has similar information in each column, but by month.
Macro Annual Budget for Current Year. Official Forecast (including Adjustments) for Current Year. Futurcast Reference Forecast for Current Year. Official Forecast (including Adjustments) for Next Year. Micro The Columns of the report consist of:
The numbers are listed in Monthly buckets A Quarterly Total is provided The Q/Y shows the percentage of the Annual Total made up by the Quarterly Total The Annual Totals with their Growth Rates versus Year Ago are shown at the bottom The growth rate versus Year Ago is listed for each Quarter Micro
Micro Note: The Micro Analysis does not have any Pre-Defined queries. The method for accessing the Micro analysis is from within the corresponding Macro analysis. For the “How To” on using this procedure, please select the “Macro to Micro” link in the main screen of this Tutorial.
Price Volume The Report shows the Yearly Currency sales for Last Year, the Current Year, and for Next Year. From these sales figures the Total Sales Growth rate from Last Year to Current Year and from Current Year to Next Year, are calculated. The purpose of the Price/Volume Analysis is to decompose the Total Currency growth trend for an entity into its Unit Sales growth versus Price growth versus Exchange Rate growth (when applicable).
Price Volume In the following three sections the Total Growth has been de-composed so that indication is given to what portion was contributed by: 1. Volume Growth: Growth portion due to Unit Sales variation. 2. Price Growth: Growth portion due to Price variation. 3. Exchange Rate Growth: Growth portion due to Exchange Rate variation.
Price Volume Note: The calculations follow the textbook multiplicative formula, and the numbers are consequently not additive.
These comparisons are conducted for both the current and the next Budget years. GAP The GAP Analysis compares the Budget with the Futurcast Reference Forecast, and the Official Forecast.