Download
1 / 31
490 likes | 956 Vues
Forest Health Monitoring. Presented By Allison Kanoti. Notice. Much of the information from the following was gleaned from fact sheets produced by the forest service…More credits are due than are given on individual slides. USDA FOREST SERVICE. Several Branches National Forest System

E N D
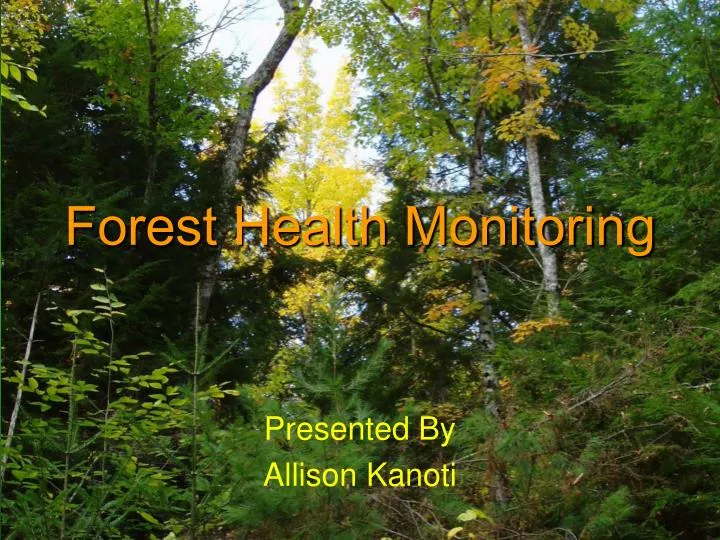
Forest Health Monitoring Presented By Allison Kanoti
Notice Much of the information from the following was gleaned from fact sheets produced by the forest service…More credits are due than are given on individual slides
USDA FOREST SERVICE Several Branches • National Forest System • State and Private Forestry • Forest Health Protection • Forest Health Monitoring • Research and Development • Forest Inventory and Analysis
FHP: Forest Health Monitoring USDA Forest Service: State and Private Forestry: FHP: FHM • Detection Monitoring • Evaluation Monitoring • Intensive Site Monitoring
Detection Monitoring Components • Determine Baseline • Detect Change • Invasive Species Detection Methods • Remote Sensing • Aerial Survey • Ground Plots (FIA, Phase 3 Plots)
Evaluation Monitoring Undesirable changes detected in Detection Monitoring: EM Investigates: Extent Severity Causes Project Proposals (often from FHP state Cooperators) Competition for funding in two categories (Base EM and Fire EM) e.g. State funding to investigate the impact of balsam woolly adelgid on balsam fir stands in New England
Intensive Site Monitoring • detailed research • better understand complex ecosystem processes • selected watershed study sites • represent major forest ecosystems • E.G. Delaware River Basin Study • began in 1999 • Model for regional collaborative monitoring networks • Cooperative • Forest Inventory and Analysis, • Forest Health Monitoring, • Global Change • U.S. Geological Survey (Water Resources Division).
Why is FIA important? “Determining the ecological and biological significance of our forest resources in an accurate and timely manner is one of the most important pursuits in modern forestry. That is the mission of the USDA Forest Service’s Forest Inventory and Analysis (FIA) Program. FIA is the most complete forest census in America, providing the only continuous national inventory that quantifies the status of forest ecosystems across all private and most public forestland. Because of its fundamental importance in measuring sustainability, FIA is universally popular among professional foresters, environmentalists, industry, private landowners, and virtually any other group that has an interest in forest management. . .” --Bob Goodlatte and James Garner, Journal of Forestry 12/99
Components of FIA From: Forest inventory and Analysis Sampling and Plot Design Bill Burkman, 2005
Components of FIA • 3 Components (Phases) • Phase 1: Remote Sensing • Classify land into Forest and Non-Forest • Quantify fragmentation, urbanization and distance variables • Phase 2: Forest Inventory Ground Plots • 1 plot per 6,000 acres • Forest (ecosystem variables) and non-forest (land use changes) • Phase 3: Forest Health Ground Plots • 1 per 16 Phase 2 plots (co-located with Phase 2 plots) • 1 plot per 96,000 acres • Forest health indicators (vegetation cover, crown, soil, lichen diversity, down woody material, ozone damage)
Plot Design: Phase 2 • 4 subplots • 24 foot radius (~1/6 acre area) • Condition Data • Site index • Stand: Age, Size, Forest Type, Disturbance, Stocking • Land Use • All trees >5” diameter • Species • History (what is condition now (live, natural mortality, removal) in comparison to past condition) • Diameter • Heights • Quality (cull, grading, merchantability) • Crown: position, condition, ratio
Plot Design: Phase 2 • 1 microplot/subplot (6.8’ radius) • All saplings 1”<DBH<5” • Diameter, Height, Crown (position, ratio) • Count of seedlings (tree species<1”) • ME 3.7’ radius plot w/in microplot • Count of shrub species • Presence of dwarf shrubs and woody vines • Used by IF&W
In addition to Phase 2 Variables: Tree Damages Additional Crown Variables Lichen Diversity Vegetation Plot Soil Sampling Down Woody Debris Plot Design: Phase 3
Summary of Forest Health in Maine:1996-1999 The following data are from: Forest Health Monitoring in Maine: 1996-1999. USDA Forest Service. NE-NF-145-02
Crown Estimates • Uncompacted live crown ratio: • % of tree height supporting live foliage • Crown light exposure: • % of foliage receiving full sunlight • Crown position: • Crown position in relation to overstory level of stand • Crown density: • amount of light blocked by branches, reproductive structures, and foliage • Crown dieback: • recent branch mortality • Foliage transparency: • amount of skylight visible through the live, normally foliated portion of the crown. Mary Ann Fajvan, West Virginia University, www.forestryimages.org
Maine 1996-1999 Crown density: • amount of light blocked by branches, reproductive structures, and foliage • 91 percent of trees had high density ratings (>30%) • 9 % low • 12% 241 • 15% 129
Crown dieback: recent branch mortality • 81 % low, 3 % high (>20 %),16% moderate (6-20%) • 5 % of red maple high, 24% moderate
Some results from phase 3 plots: Transparency Maine 1996-1999 Foliage transparency: amount of skylight visible through the live, normally foliated portion of the crown. 99 percent of trees had normal transparency
Location Roots and Stump Bole Lower Upper Crownstem Branches Buds and Shoots Foliage Thresholds and Severity Ratings Types Canker, gall Advanced Decay Open wounds Resinosis, gummosis Cracks and seams Broken bole or roots Broken or dead top Broken or dead branches Vines Brooms on roots, bole, crown Damaged buds, foliage or shoots Foliage discoloration Other Damages
Some results from phase 3 plots: Damage All Species Damage Percentages 81 percent of trees no damage 15 percent one damage 4 percent 2 or more damages Red Spruce 6 % damaged 21% seams/cracks Northern White Cedar 33% damaged (>75% decay) Eastern White Pine 14 percent damaged 44 percent dead or broken top 29 percent dead or broken branch
Summary: Maine 1996-1999 • Most trees are healthy: • Full crowns • Little dieback • Little damage
Credit Where Due The following slide images are pirated from: Steinman, J. 2004. Forest Health Monitoring in the Northeastern United States: Disturbances and Conditions during 1993-2002. USDA Forest Service. NA-TP-01-04
Health of All Trees Combined • Growth rates low in N. Me, S. teir PA, Central MN (yellow thru red) • Mortality a concern in many counties (yellow thru red)
Why low growth/high mortality? • Unhealthy Crowns: • >25% dieback • >30% transparency • <35% density • NY and NE crowns less healthy than the region in general
Health of Balsam Fir • Low net growth reflects high mortality
Conclusion Data collected by FIA and FHP are important resources for assessing the state of the nation’s forests and the threats to forest health and analyzing long term forest trends